
A month in Tidings
Every screen below comes from the live demo — eleven months of a fictional household’s spending. This is the shape of a month once the pipeline is wired: alerts arrive by email, parsers file them, and these pages assemble themselves.
The journal
Section titled “The journal”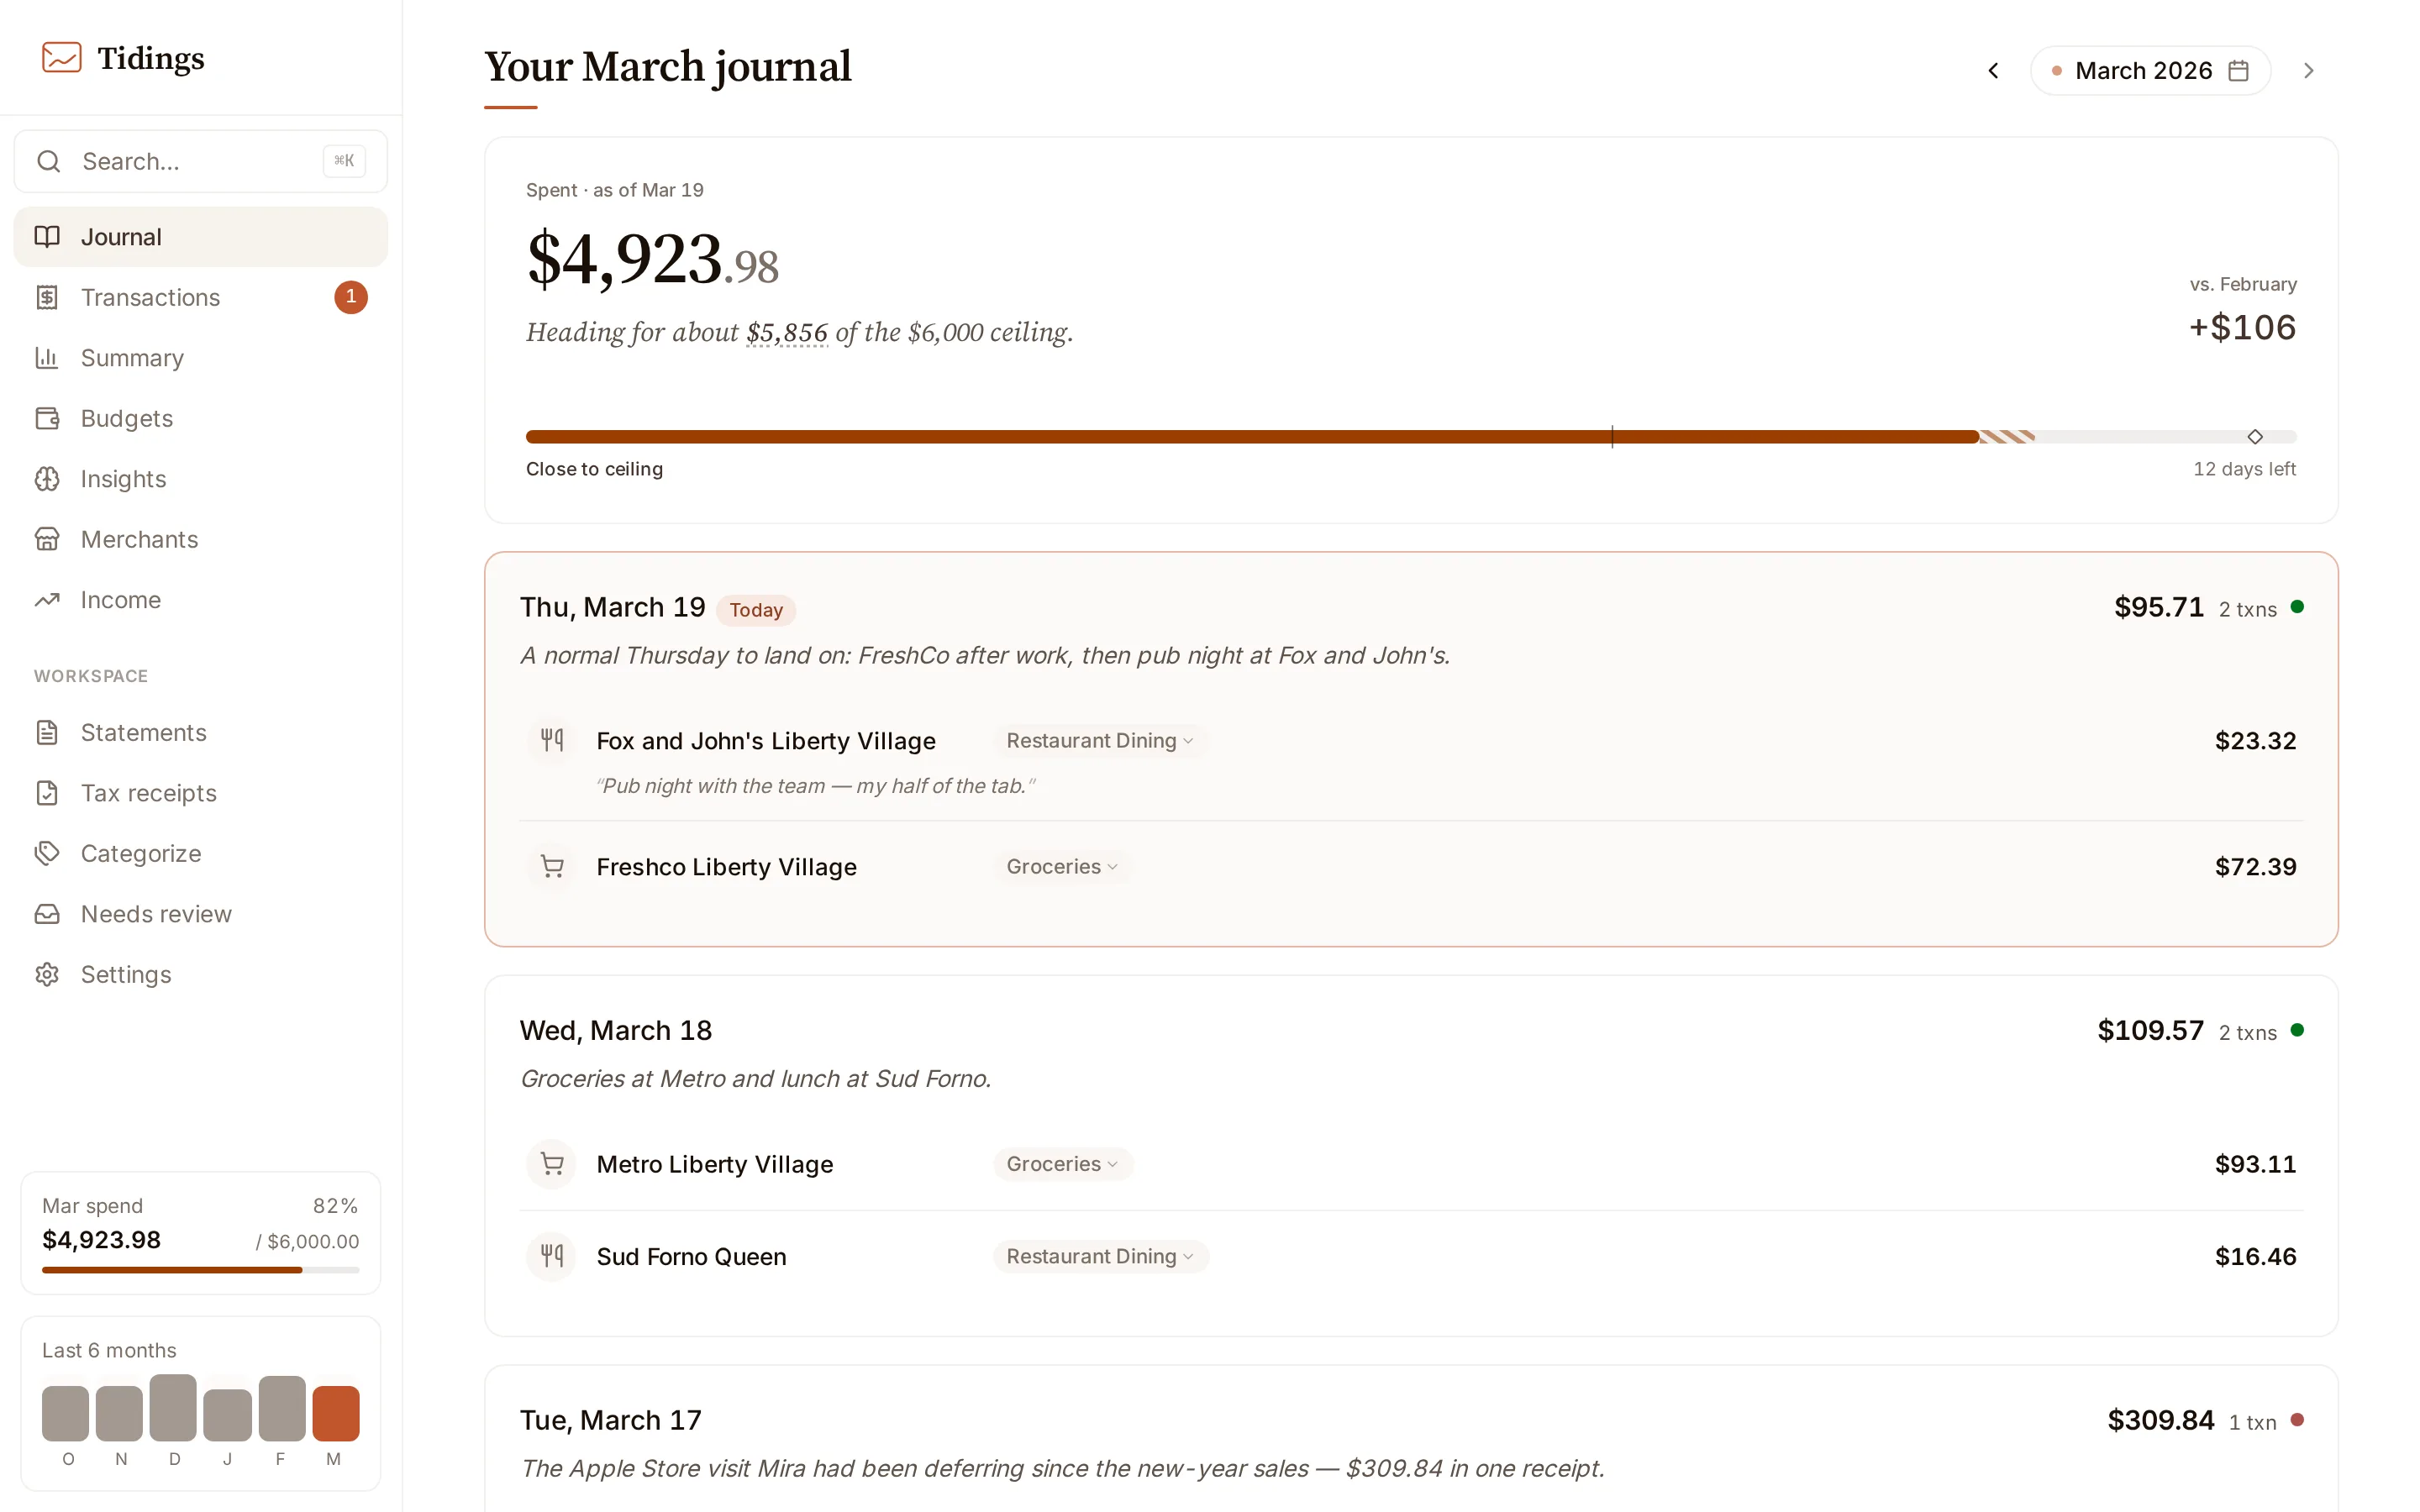
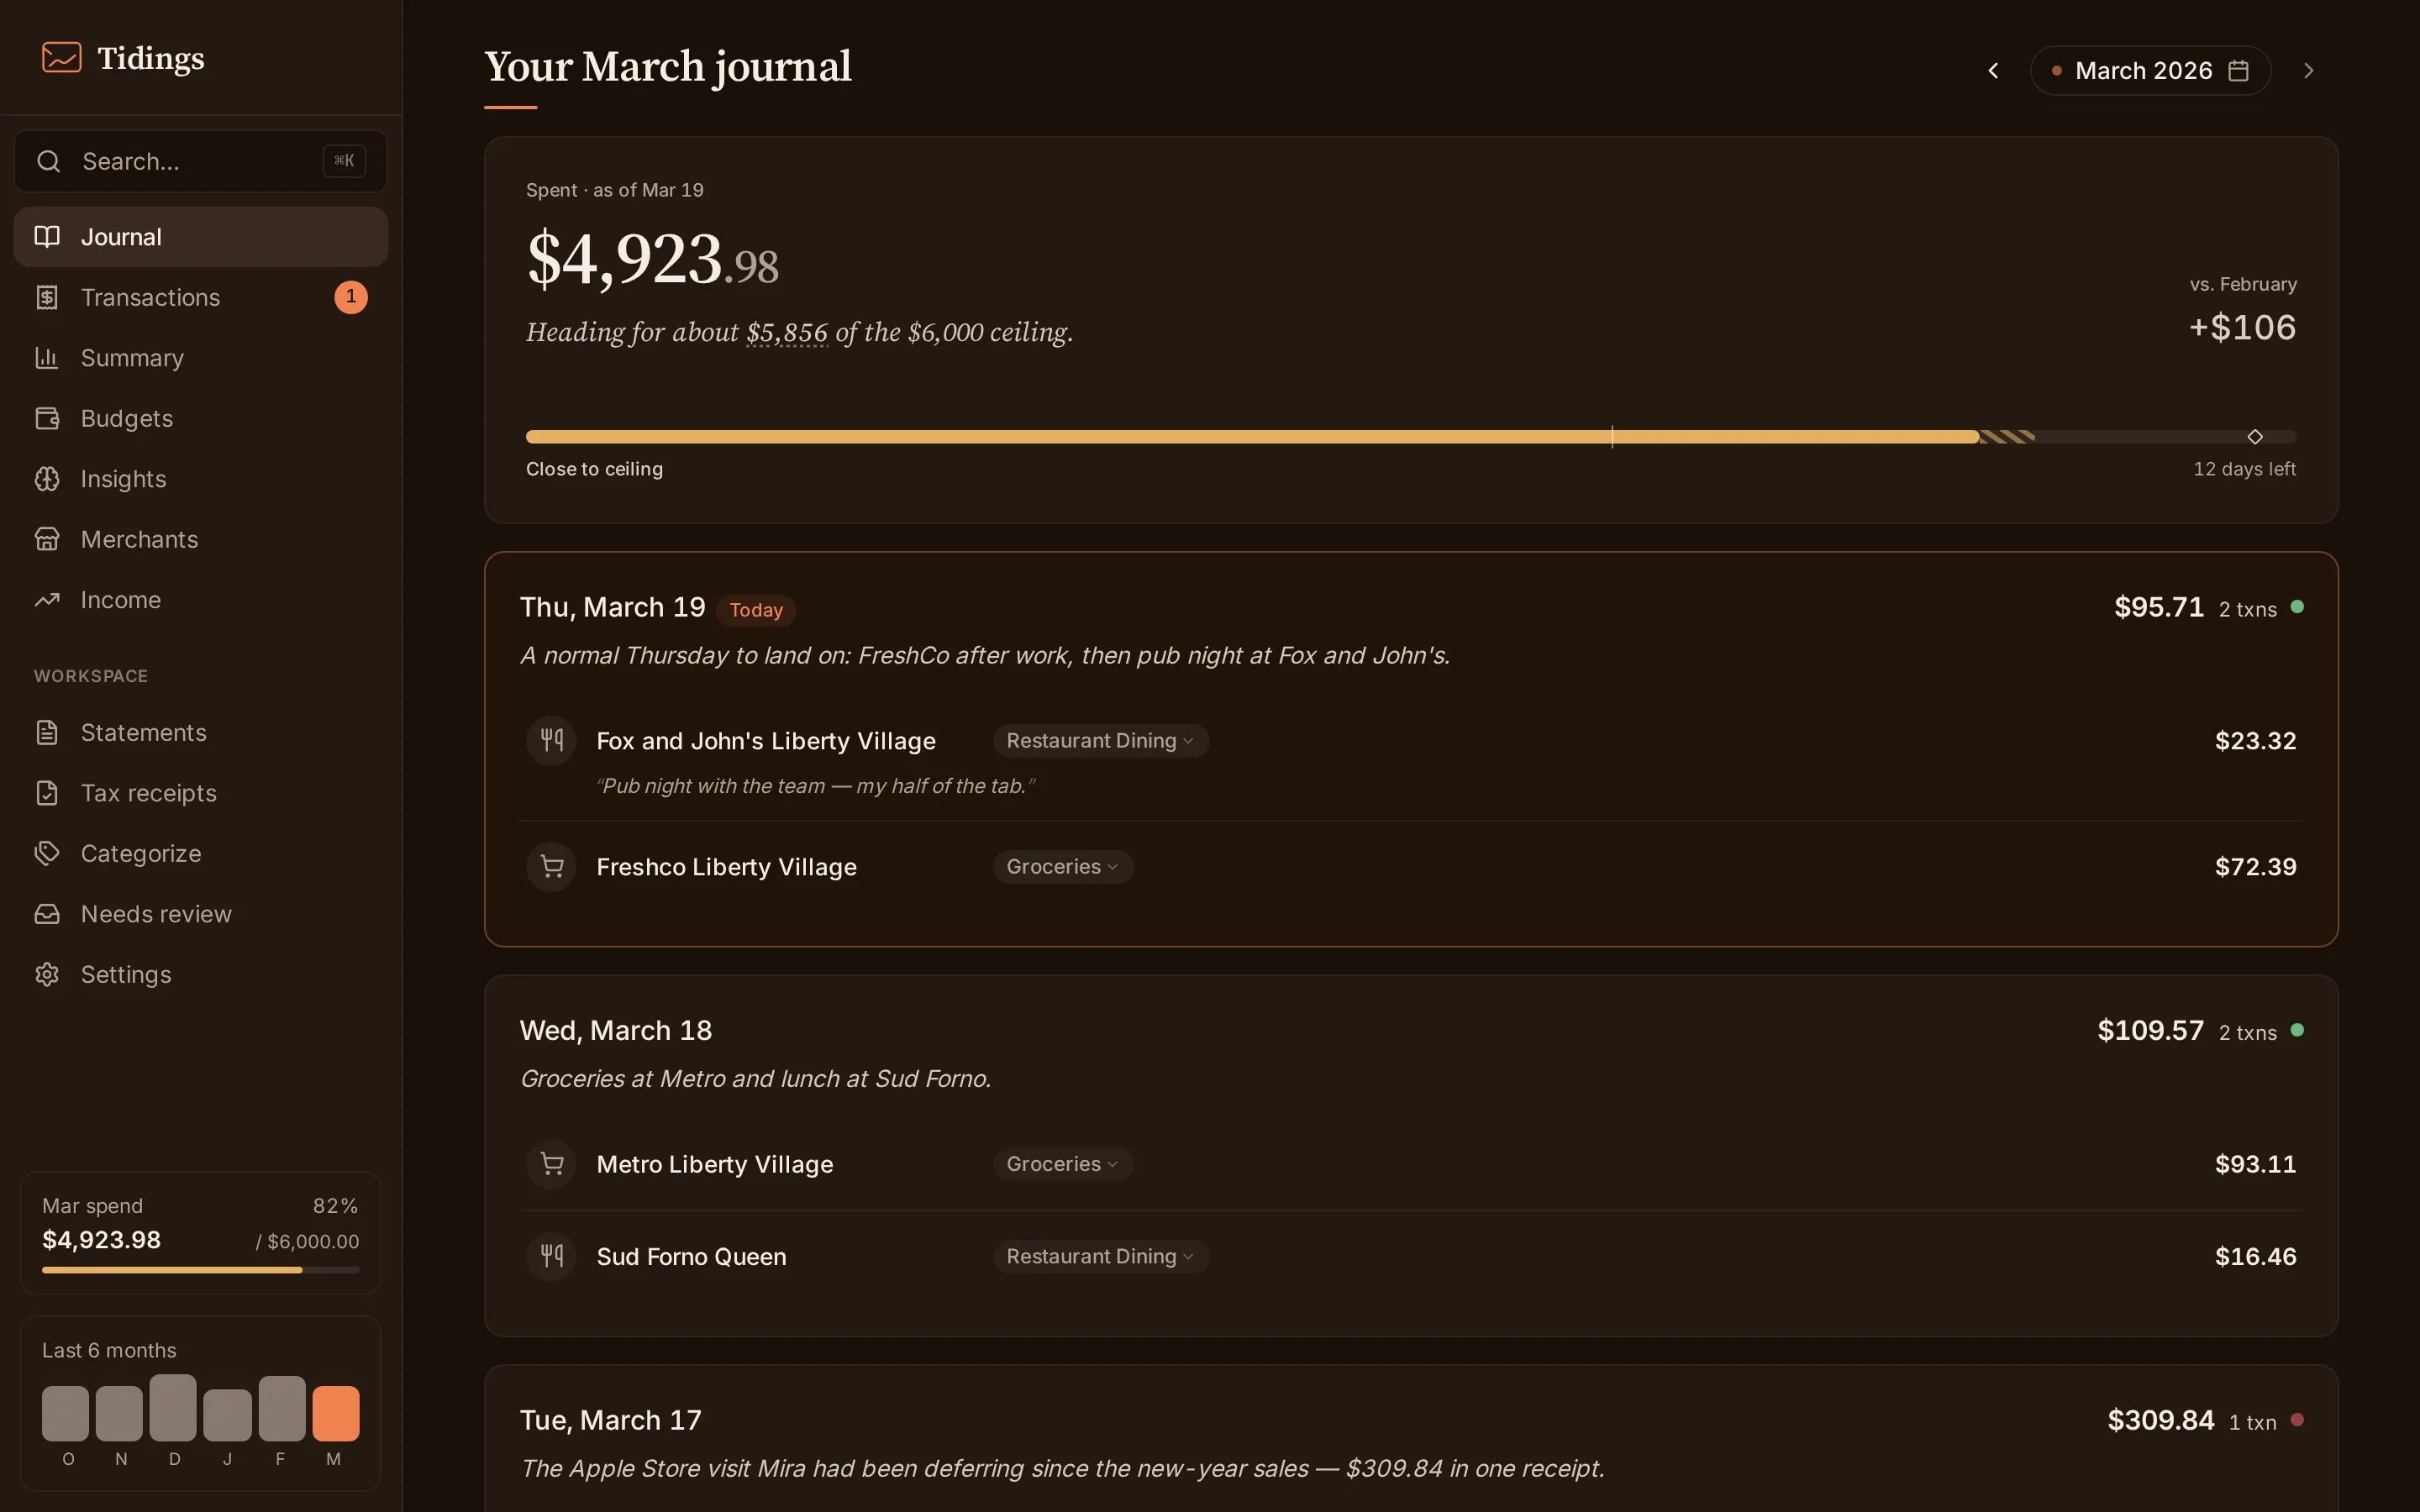
A month, read one day at a time, newest first. Each day carries its own total, and the month accumulates as you scroll. Only spending you can act on appears here — refunds, transfers, and anything you ignore stay in the full ledger.
The summary
Section titled “The summary”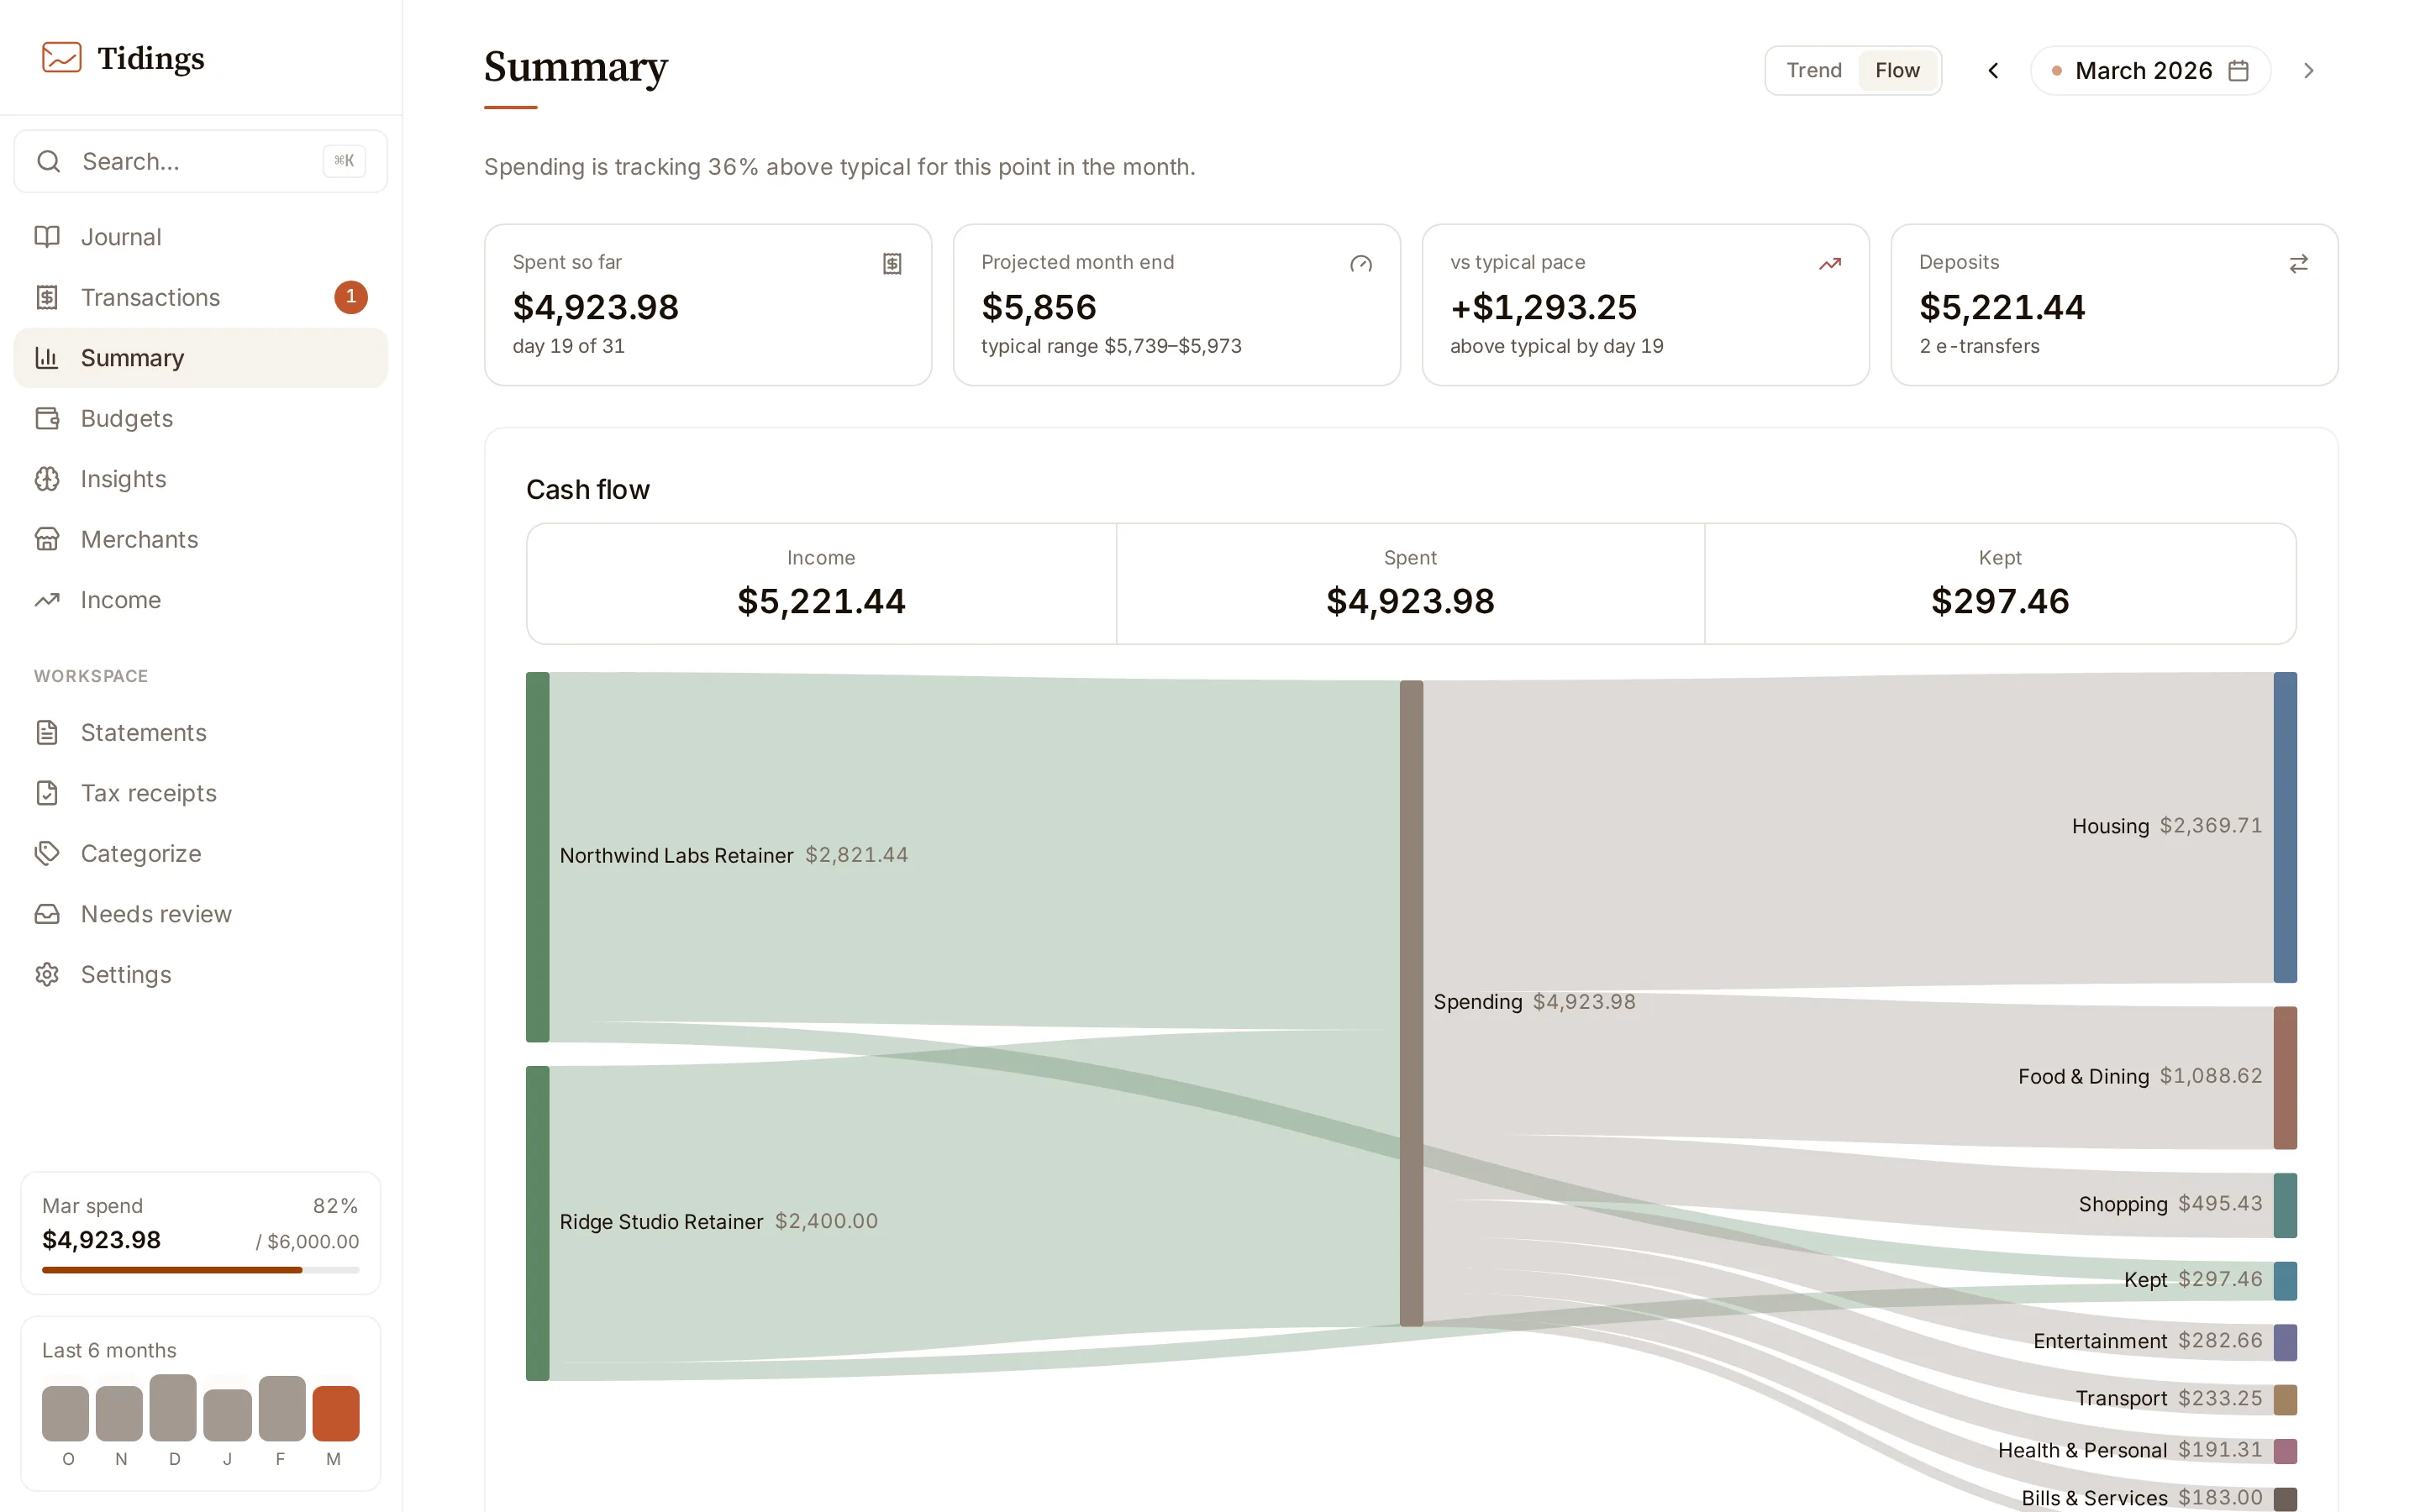
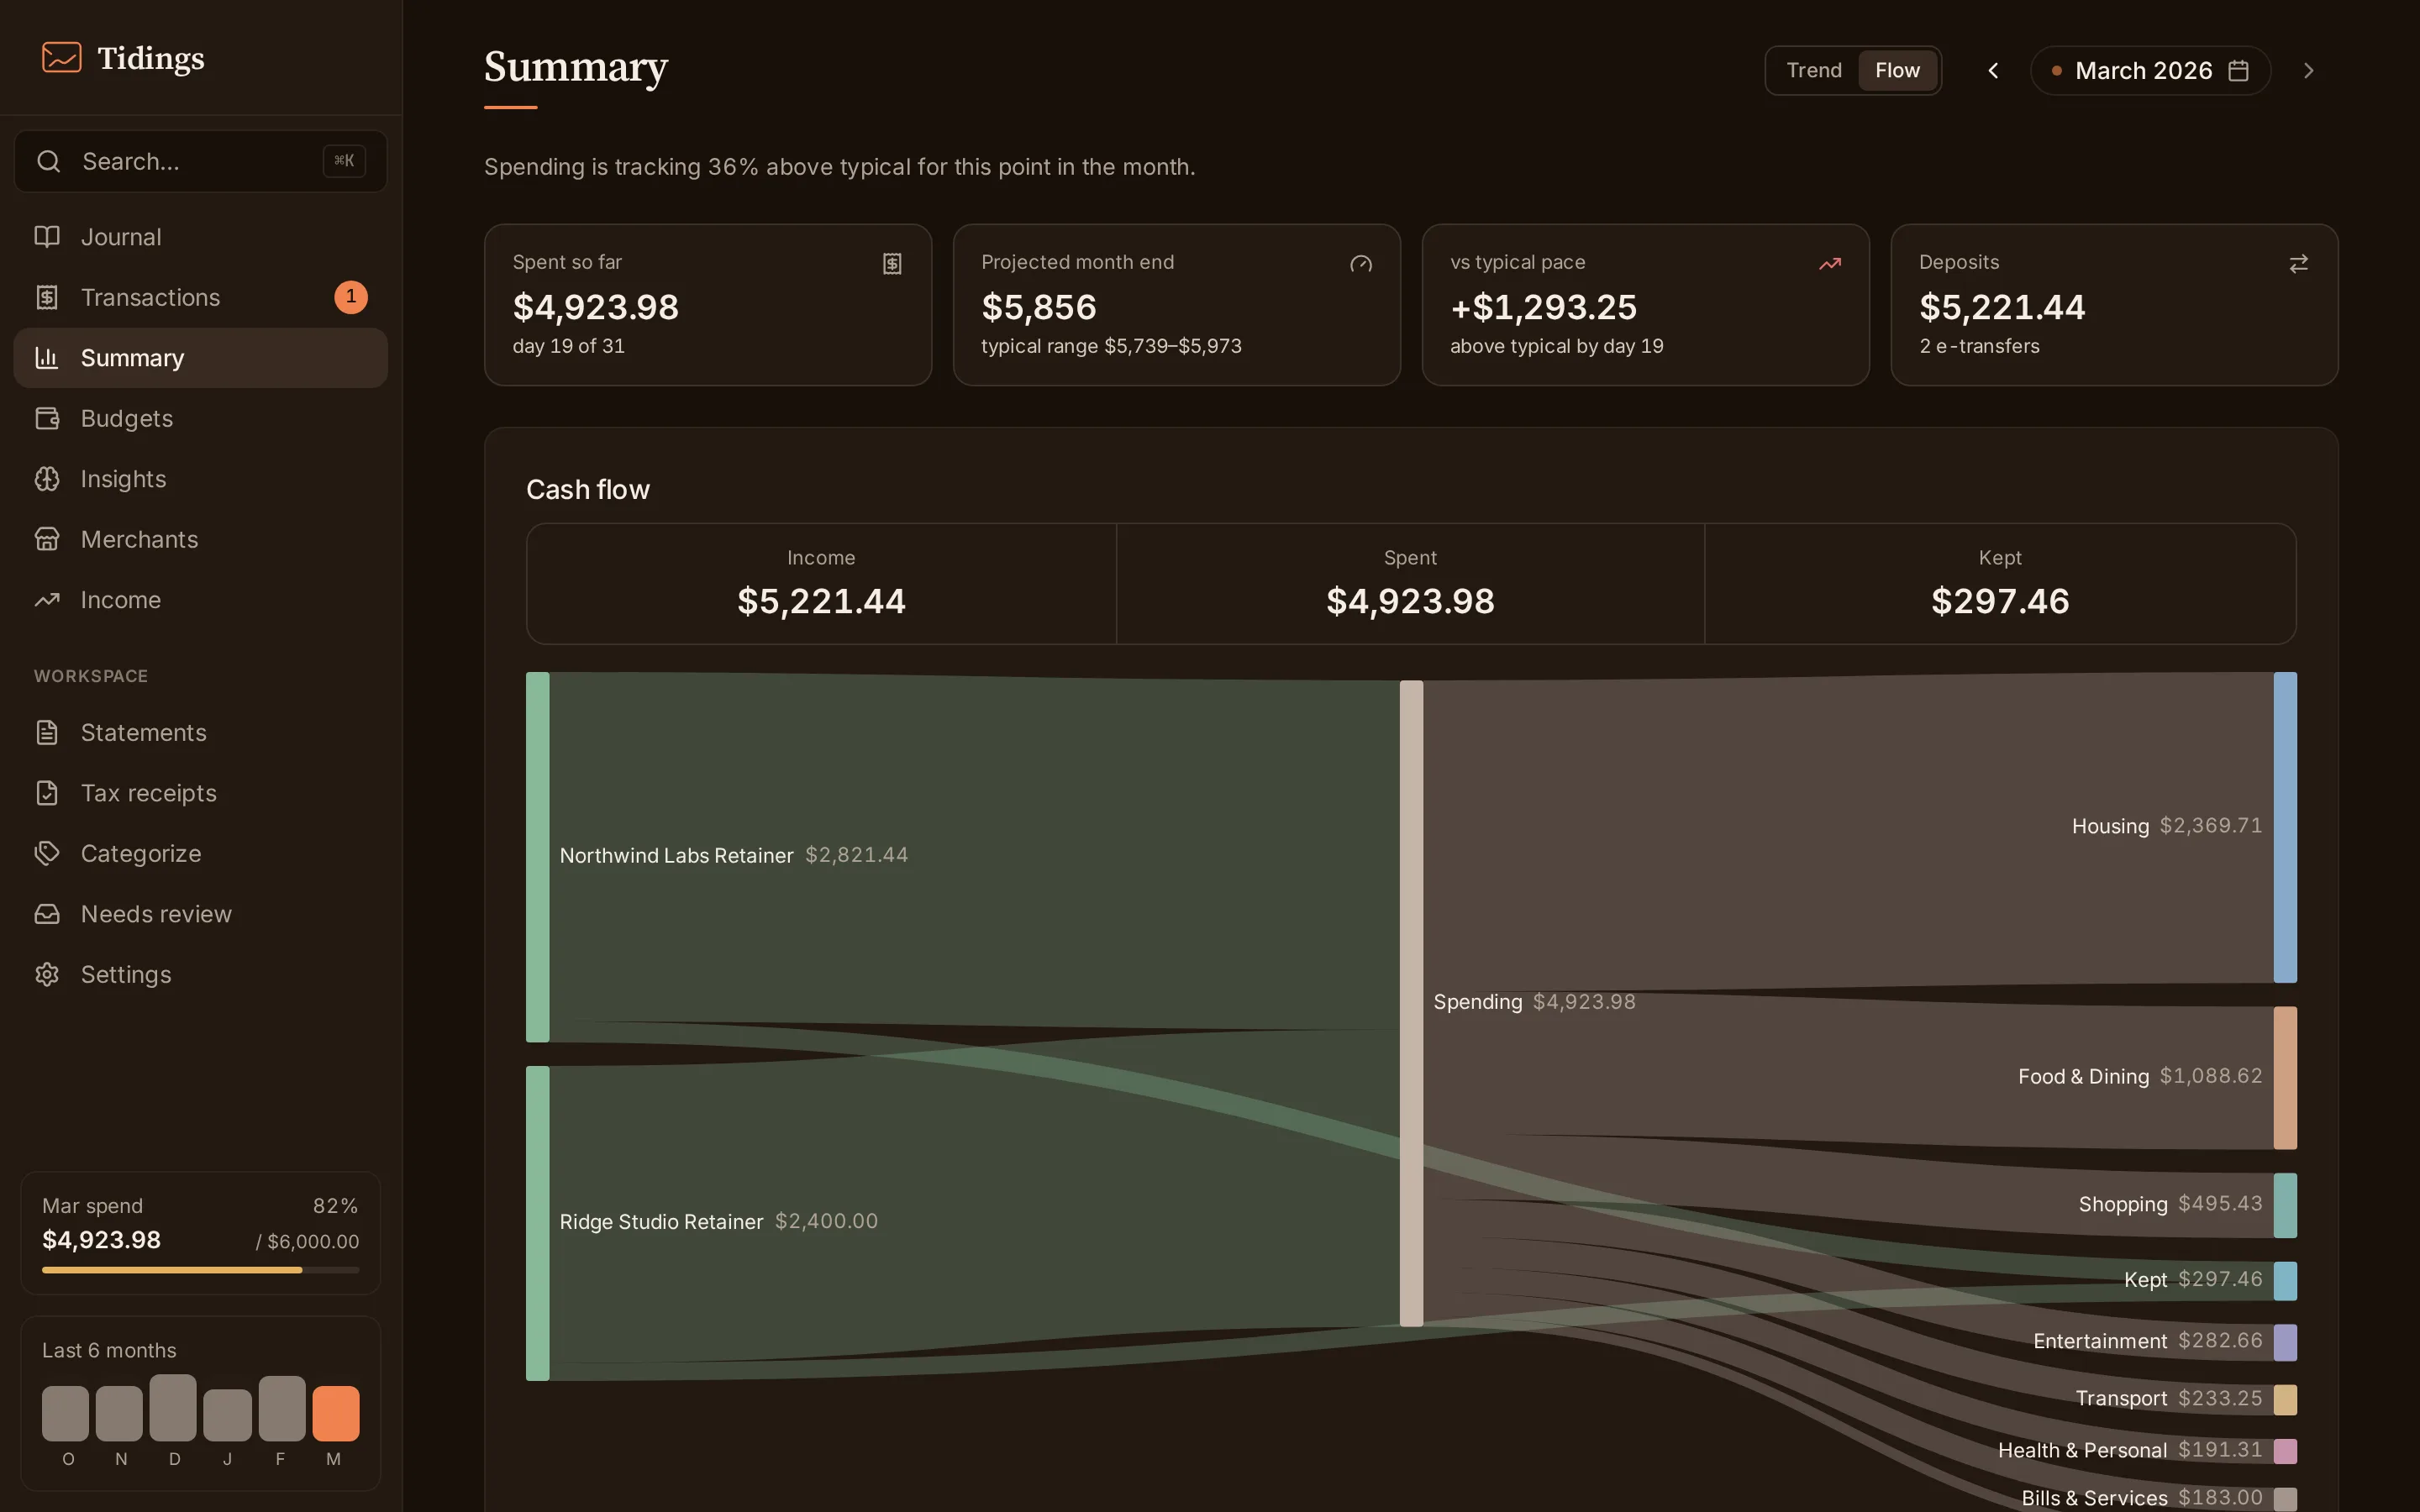
One page scoped to the month in the picker. The Flow view is a Sankey diagram of where the month went — income on one side, category groups on the other; toggle to Trend for the month against recent history. The headline sentence is assembled from the page’s own figures, not written by a model.
Budgets
Section titled “Budgets”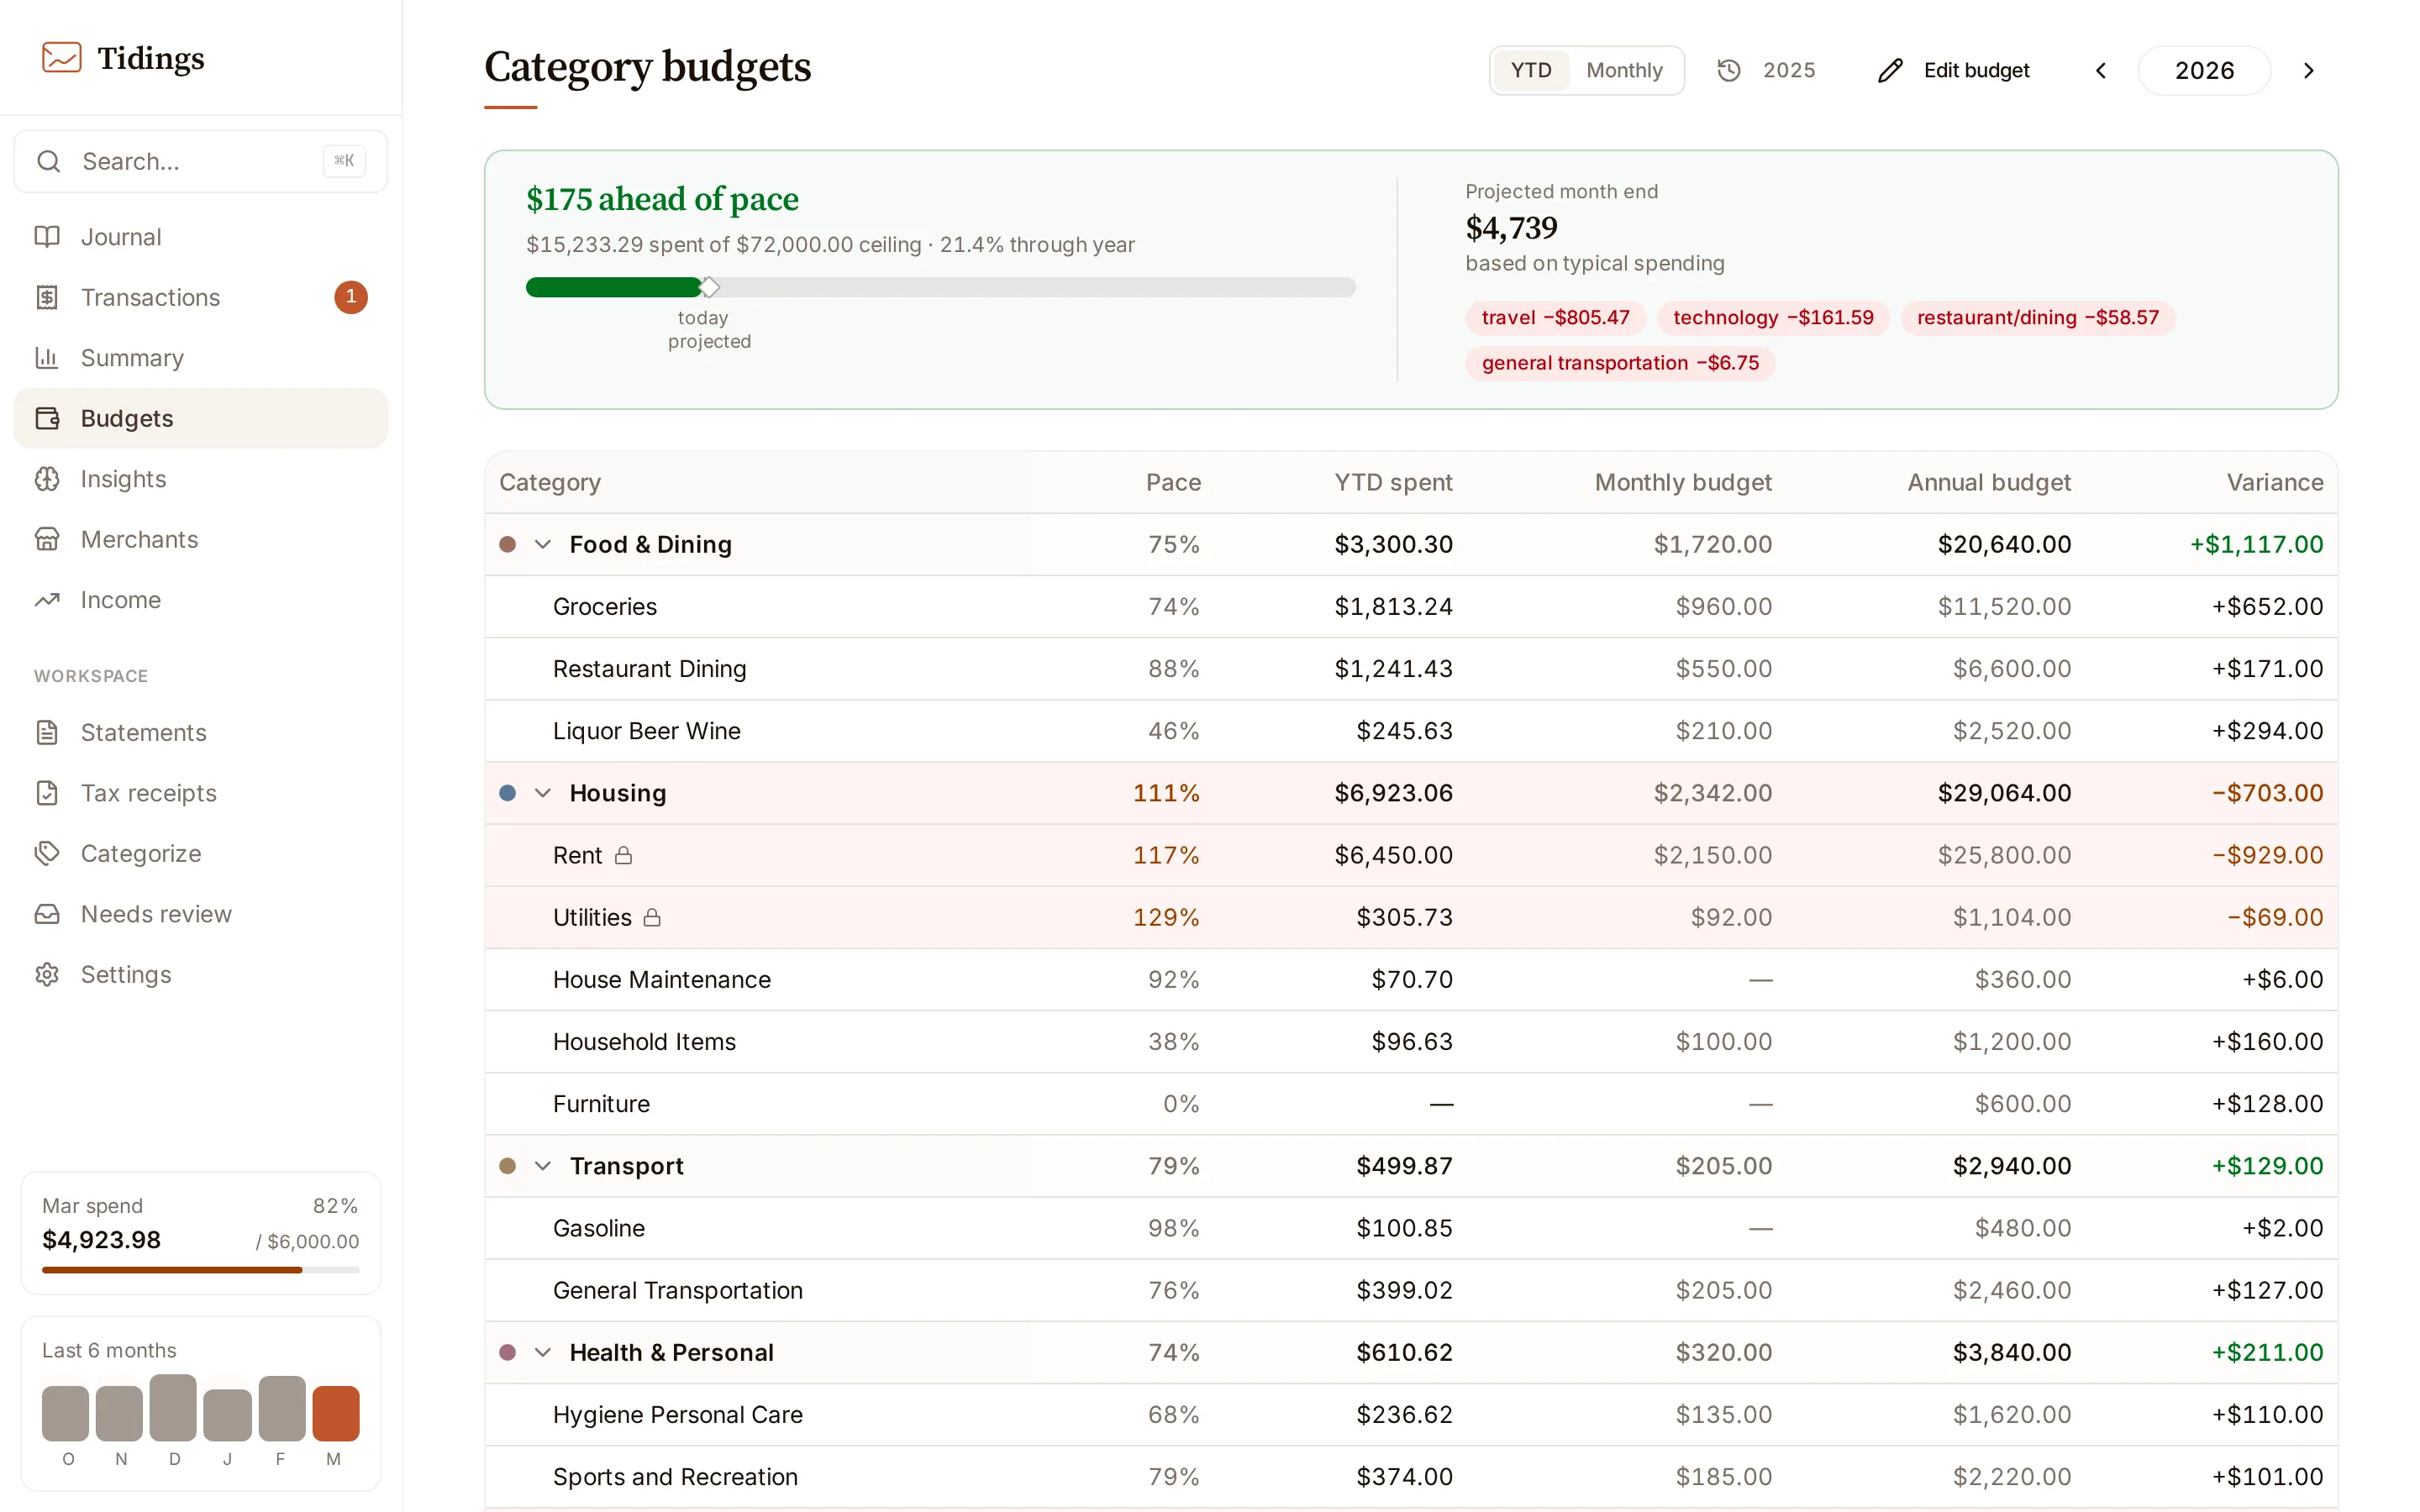
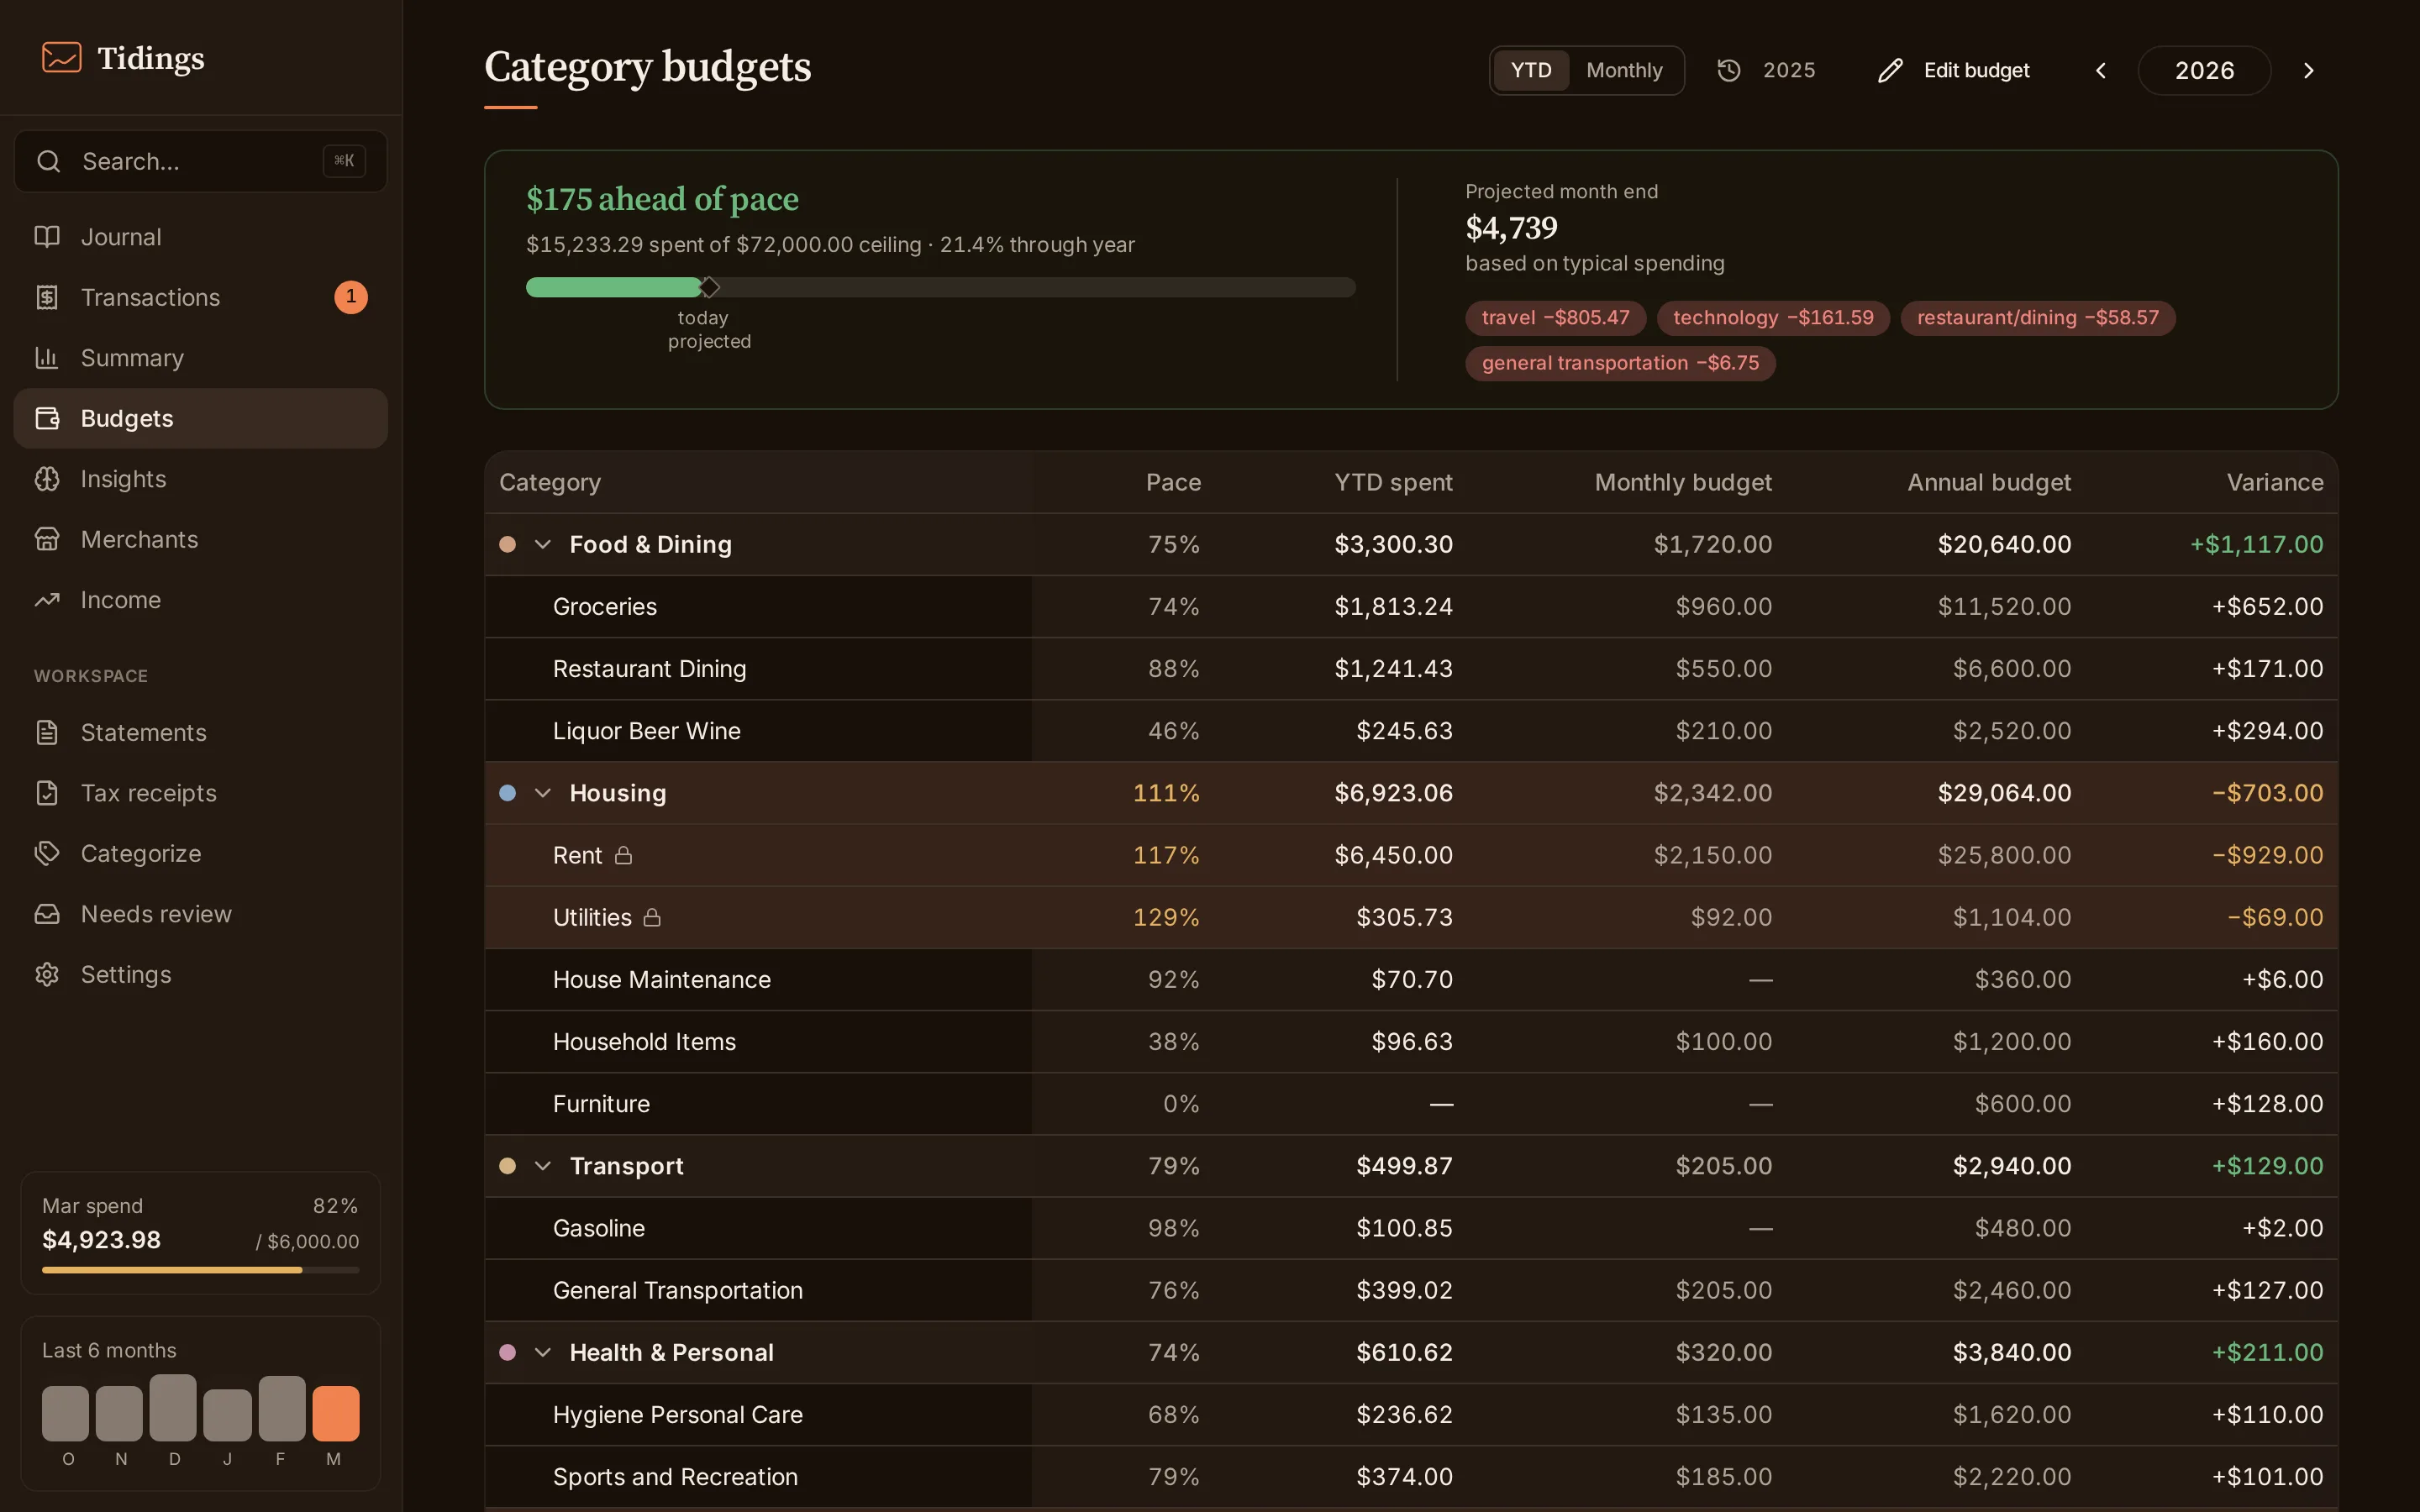
Budgets are annual. You set a target per category, and the dashboard reads year-to-date spending against the elapsed fraction of the year — two months in, roughly a sixth of the year has passed. A separate ceiling caps total spending, and pace tells you whether the year is running ahead or behind.
Insights
Section titled “Insights”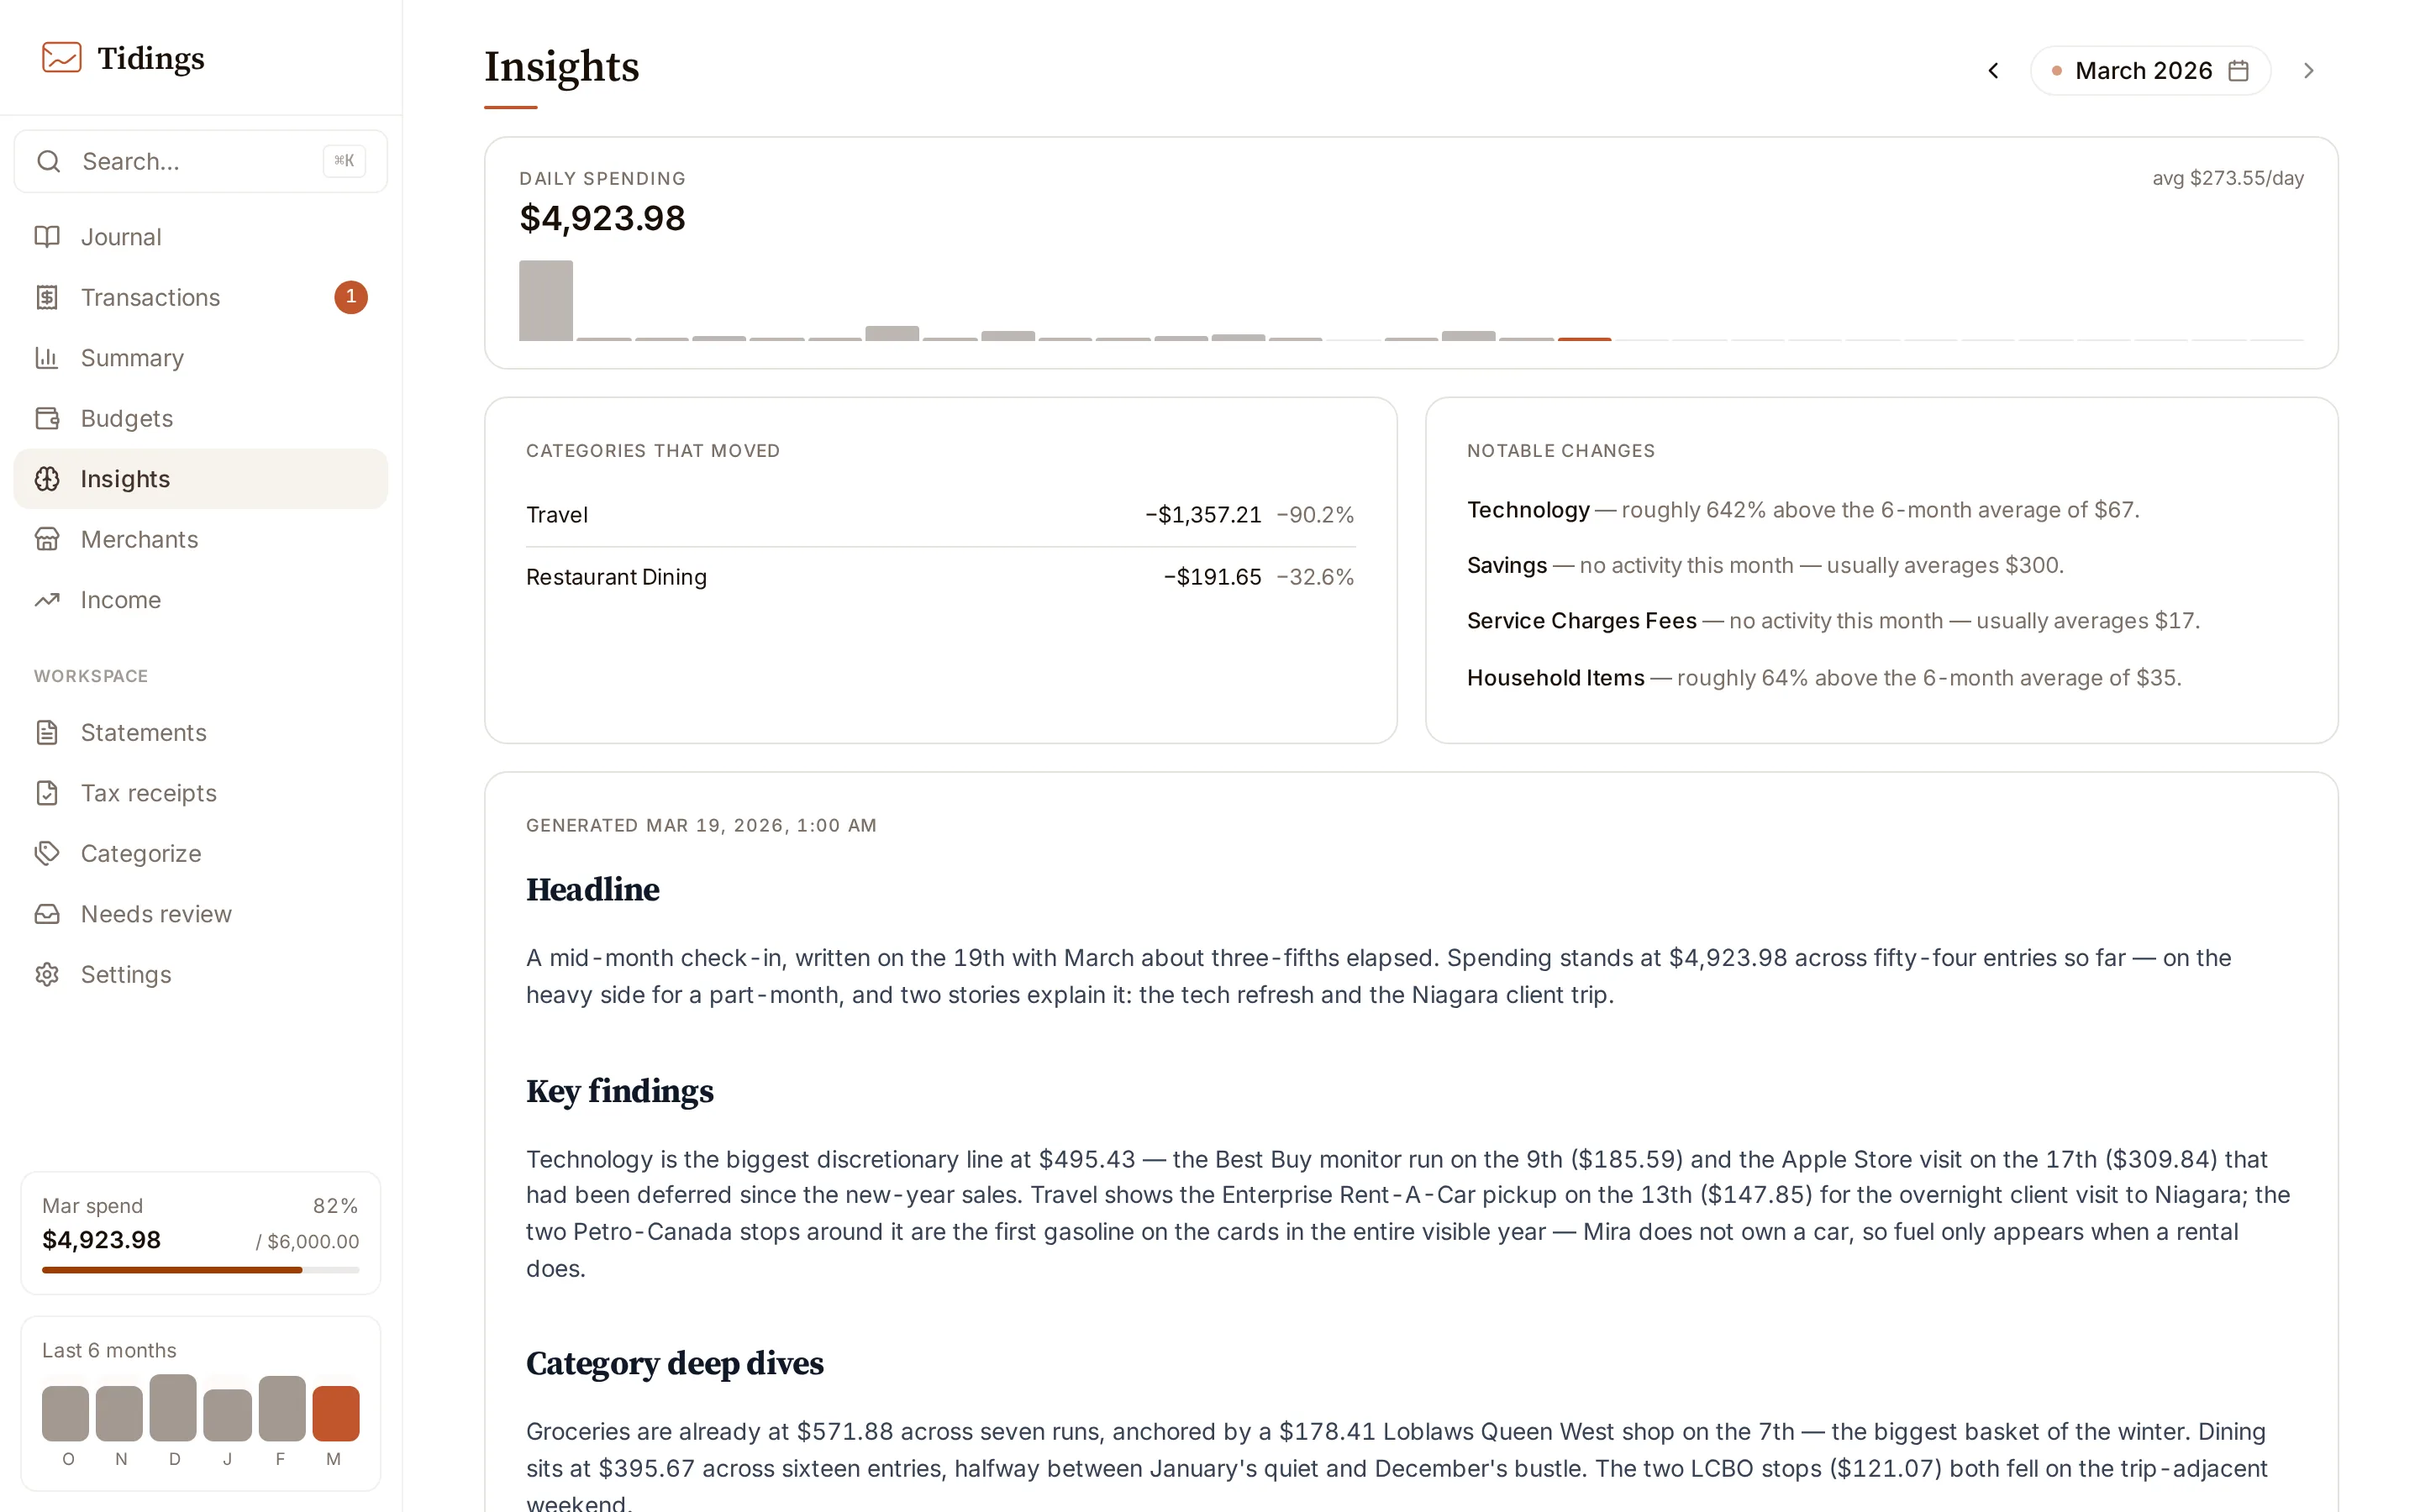
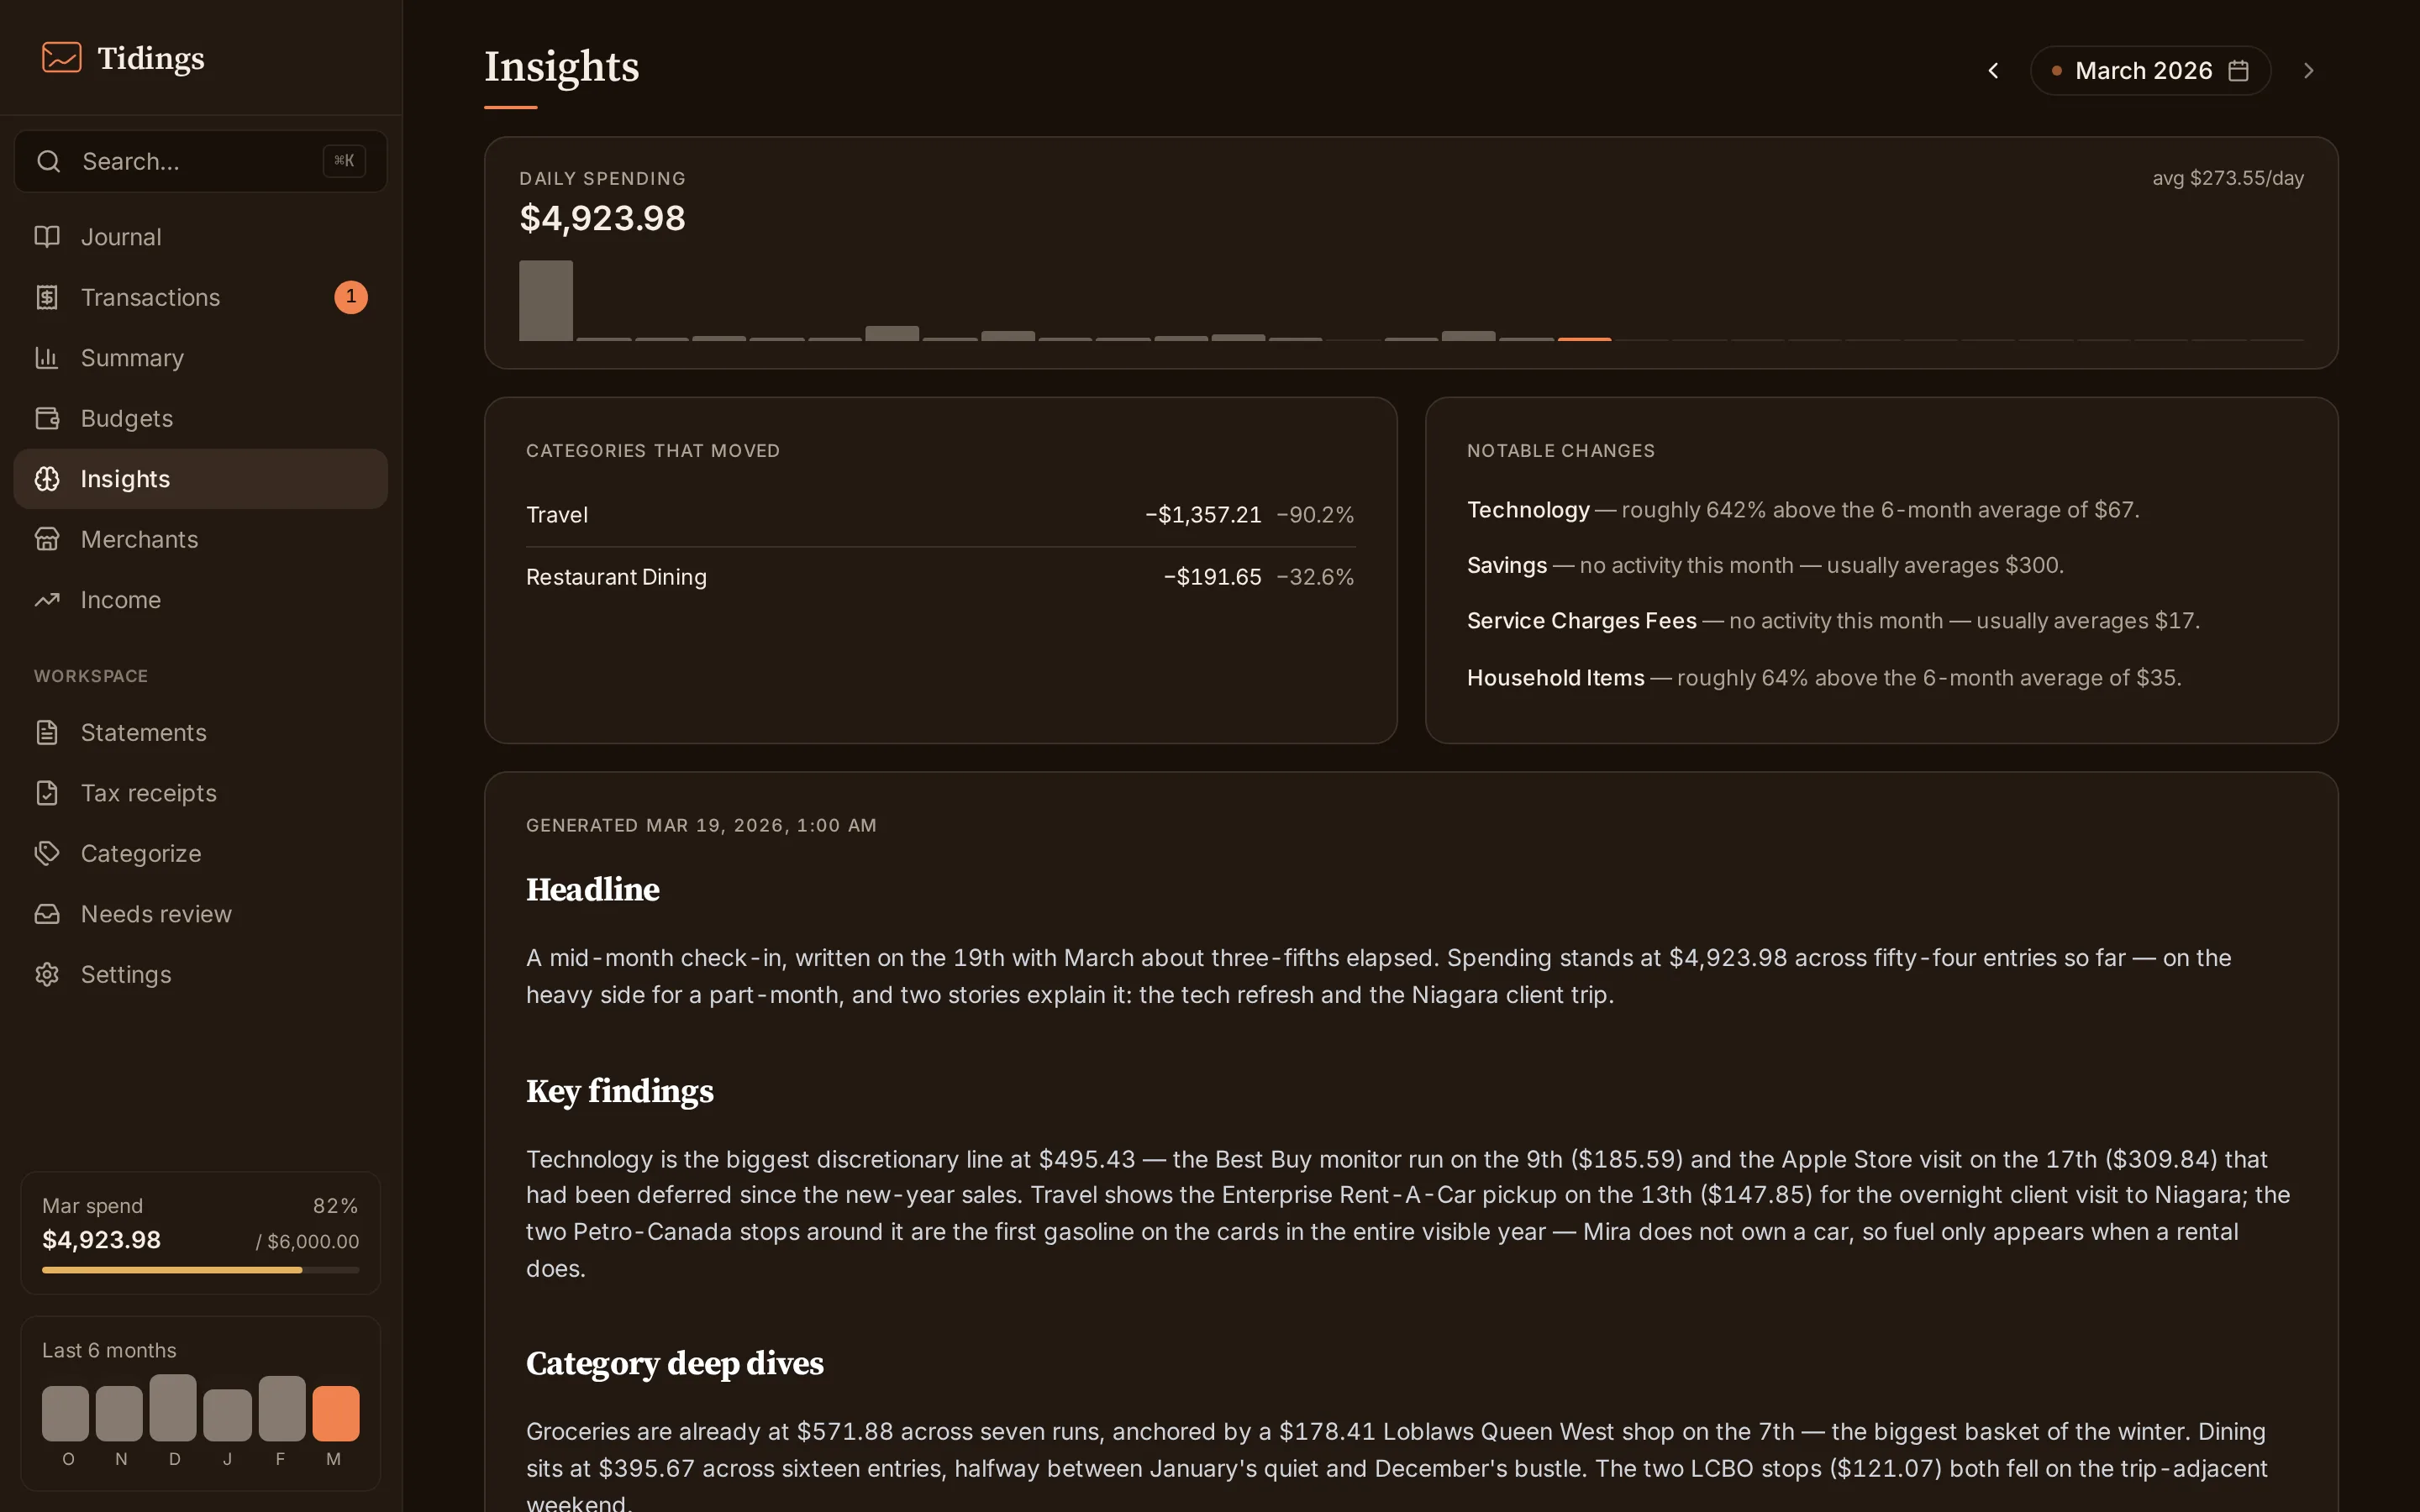
The monthly briefing workspace. The cards on top — momentum against last month, and the month’s quiet anomalies — are computed directly from your transactions; no model is involved. The narrative below is AI-written and opt-in, follows the same fixed shape every month, and after generation every figure in it is traced back to the underlying numbers.
Merchants
Section titled “Merchants”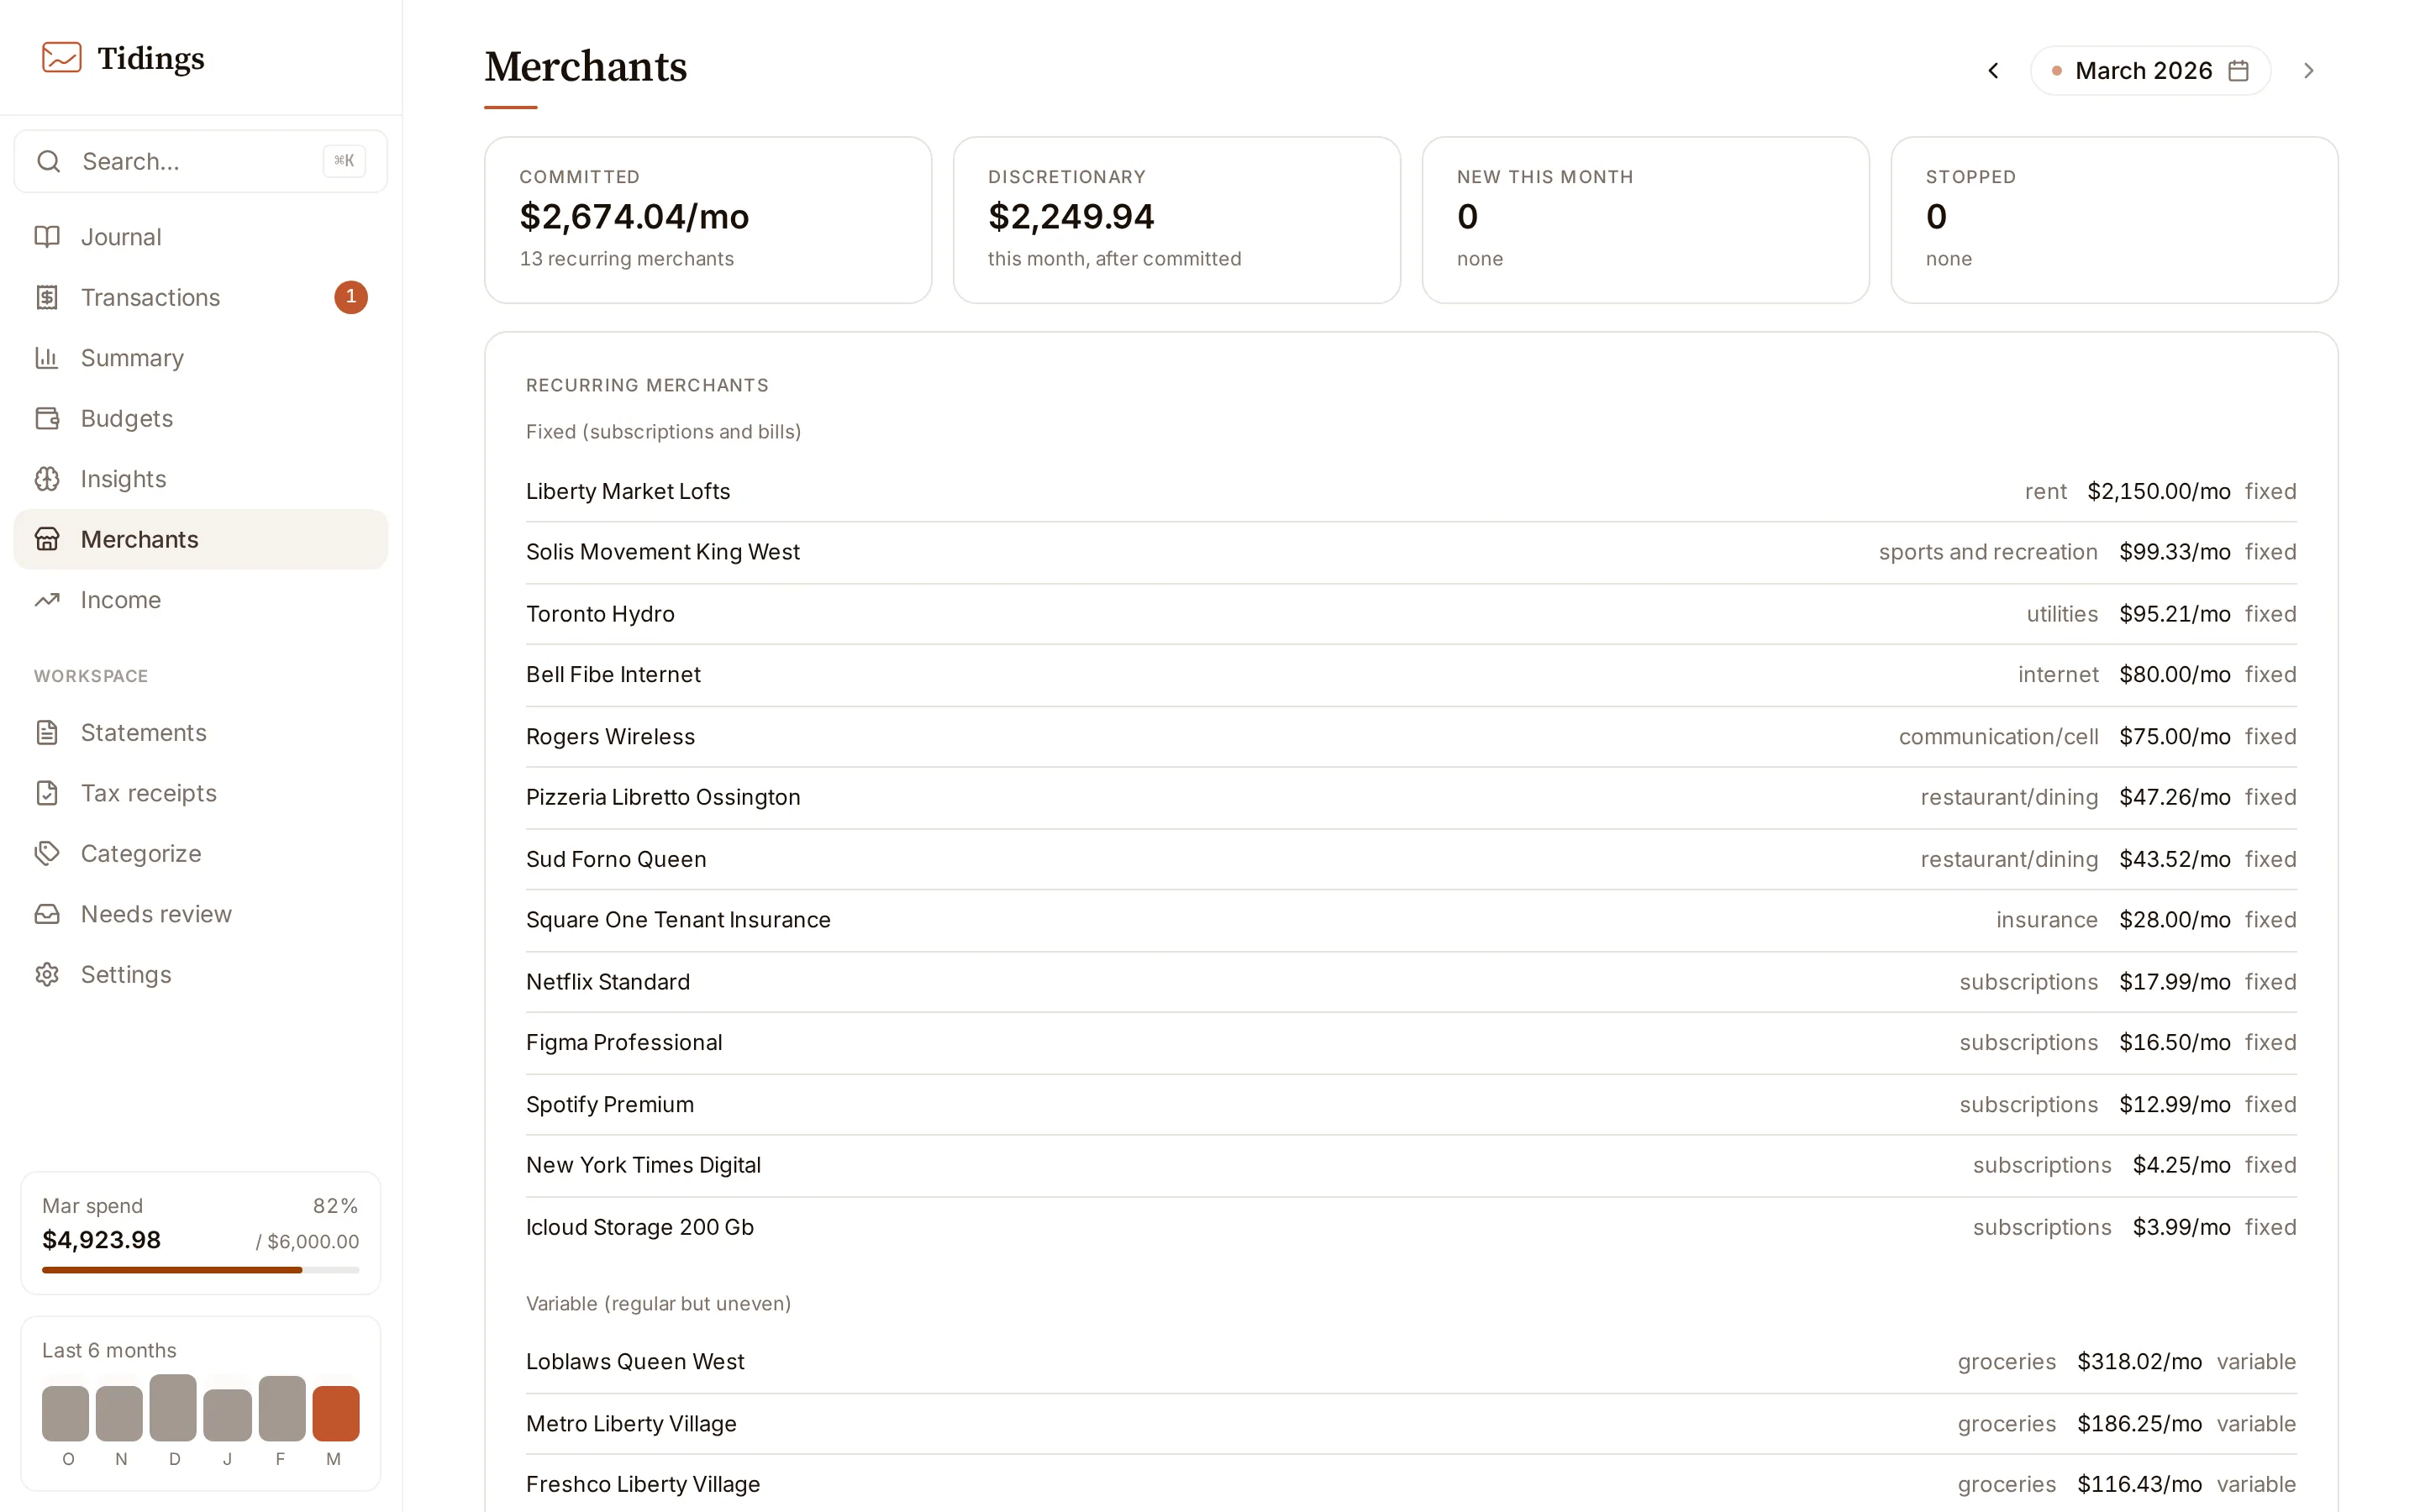
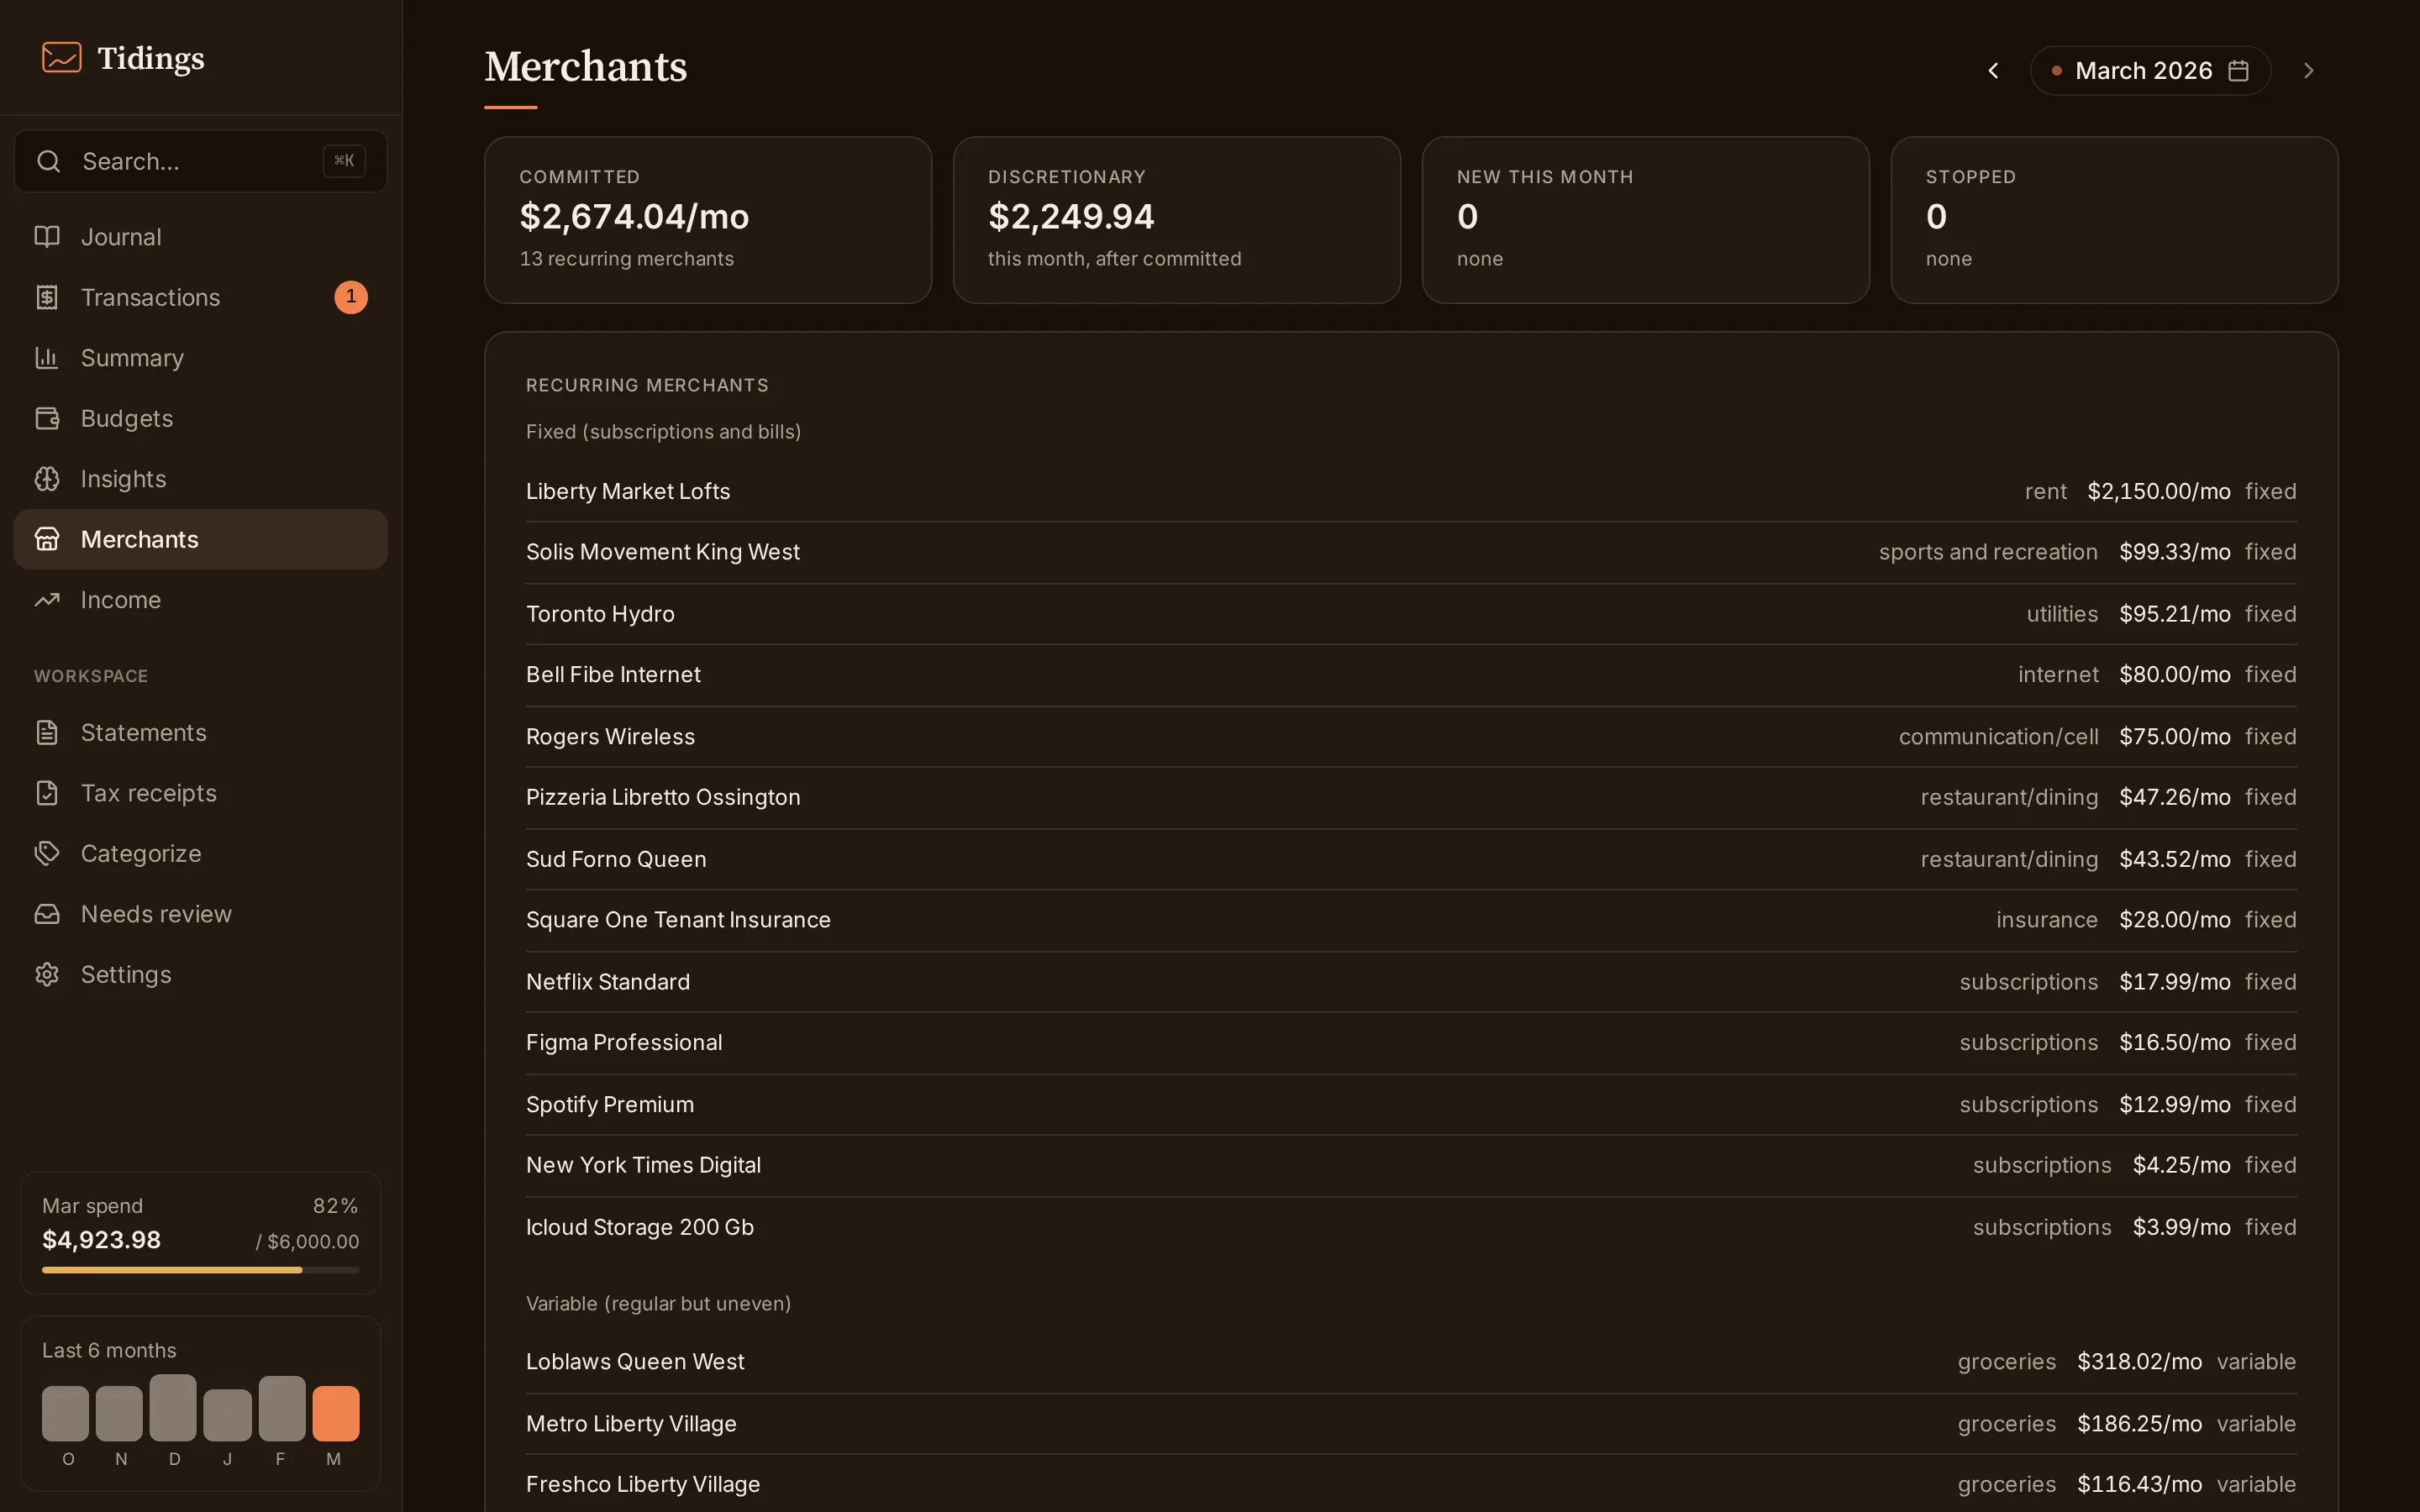
Who you pay, across the trailing six months. Recurring merchants are detected and typed — fixed, variable, lumpy — and the fixed ones sum to a recurring burn rate: the spending locked in before the month begins. Price changes, new merchants, and churned ones are surfaced alongside.
Where next
Section titled “Where next”- Try the demo — the same data, live, no install.
- Quickstart — three commands and a browser tab.
- Or let an agent introduce you:
Introduce me to Tidings. Read https://docs.gettidings.com/agent-guide.md, then use the live demo API to show me what a month of spending looks like.